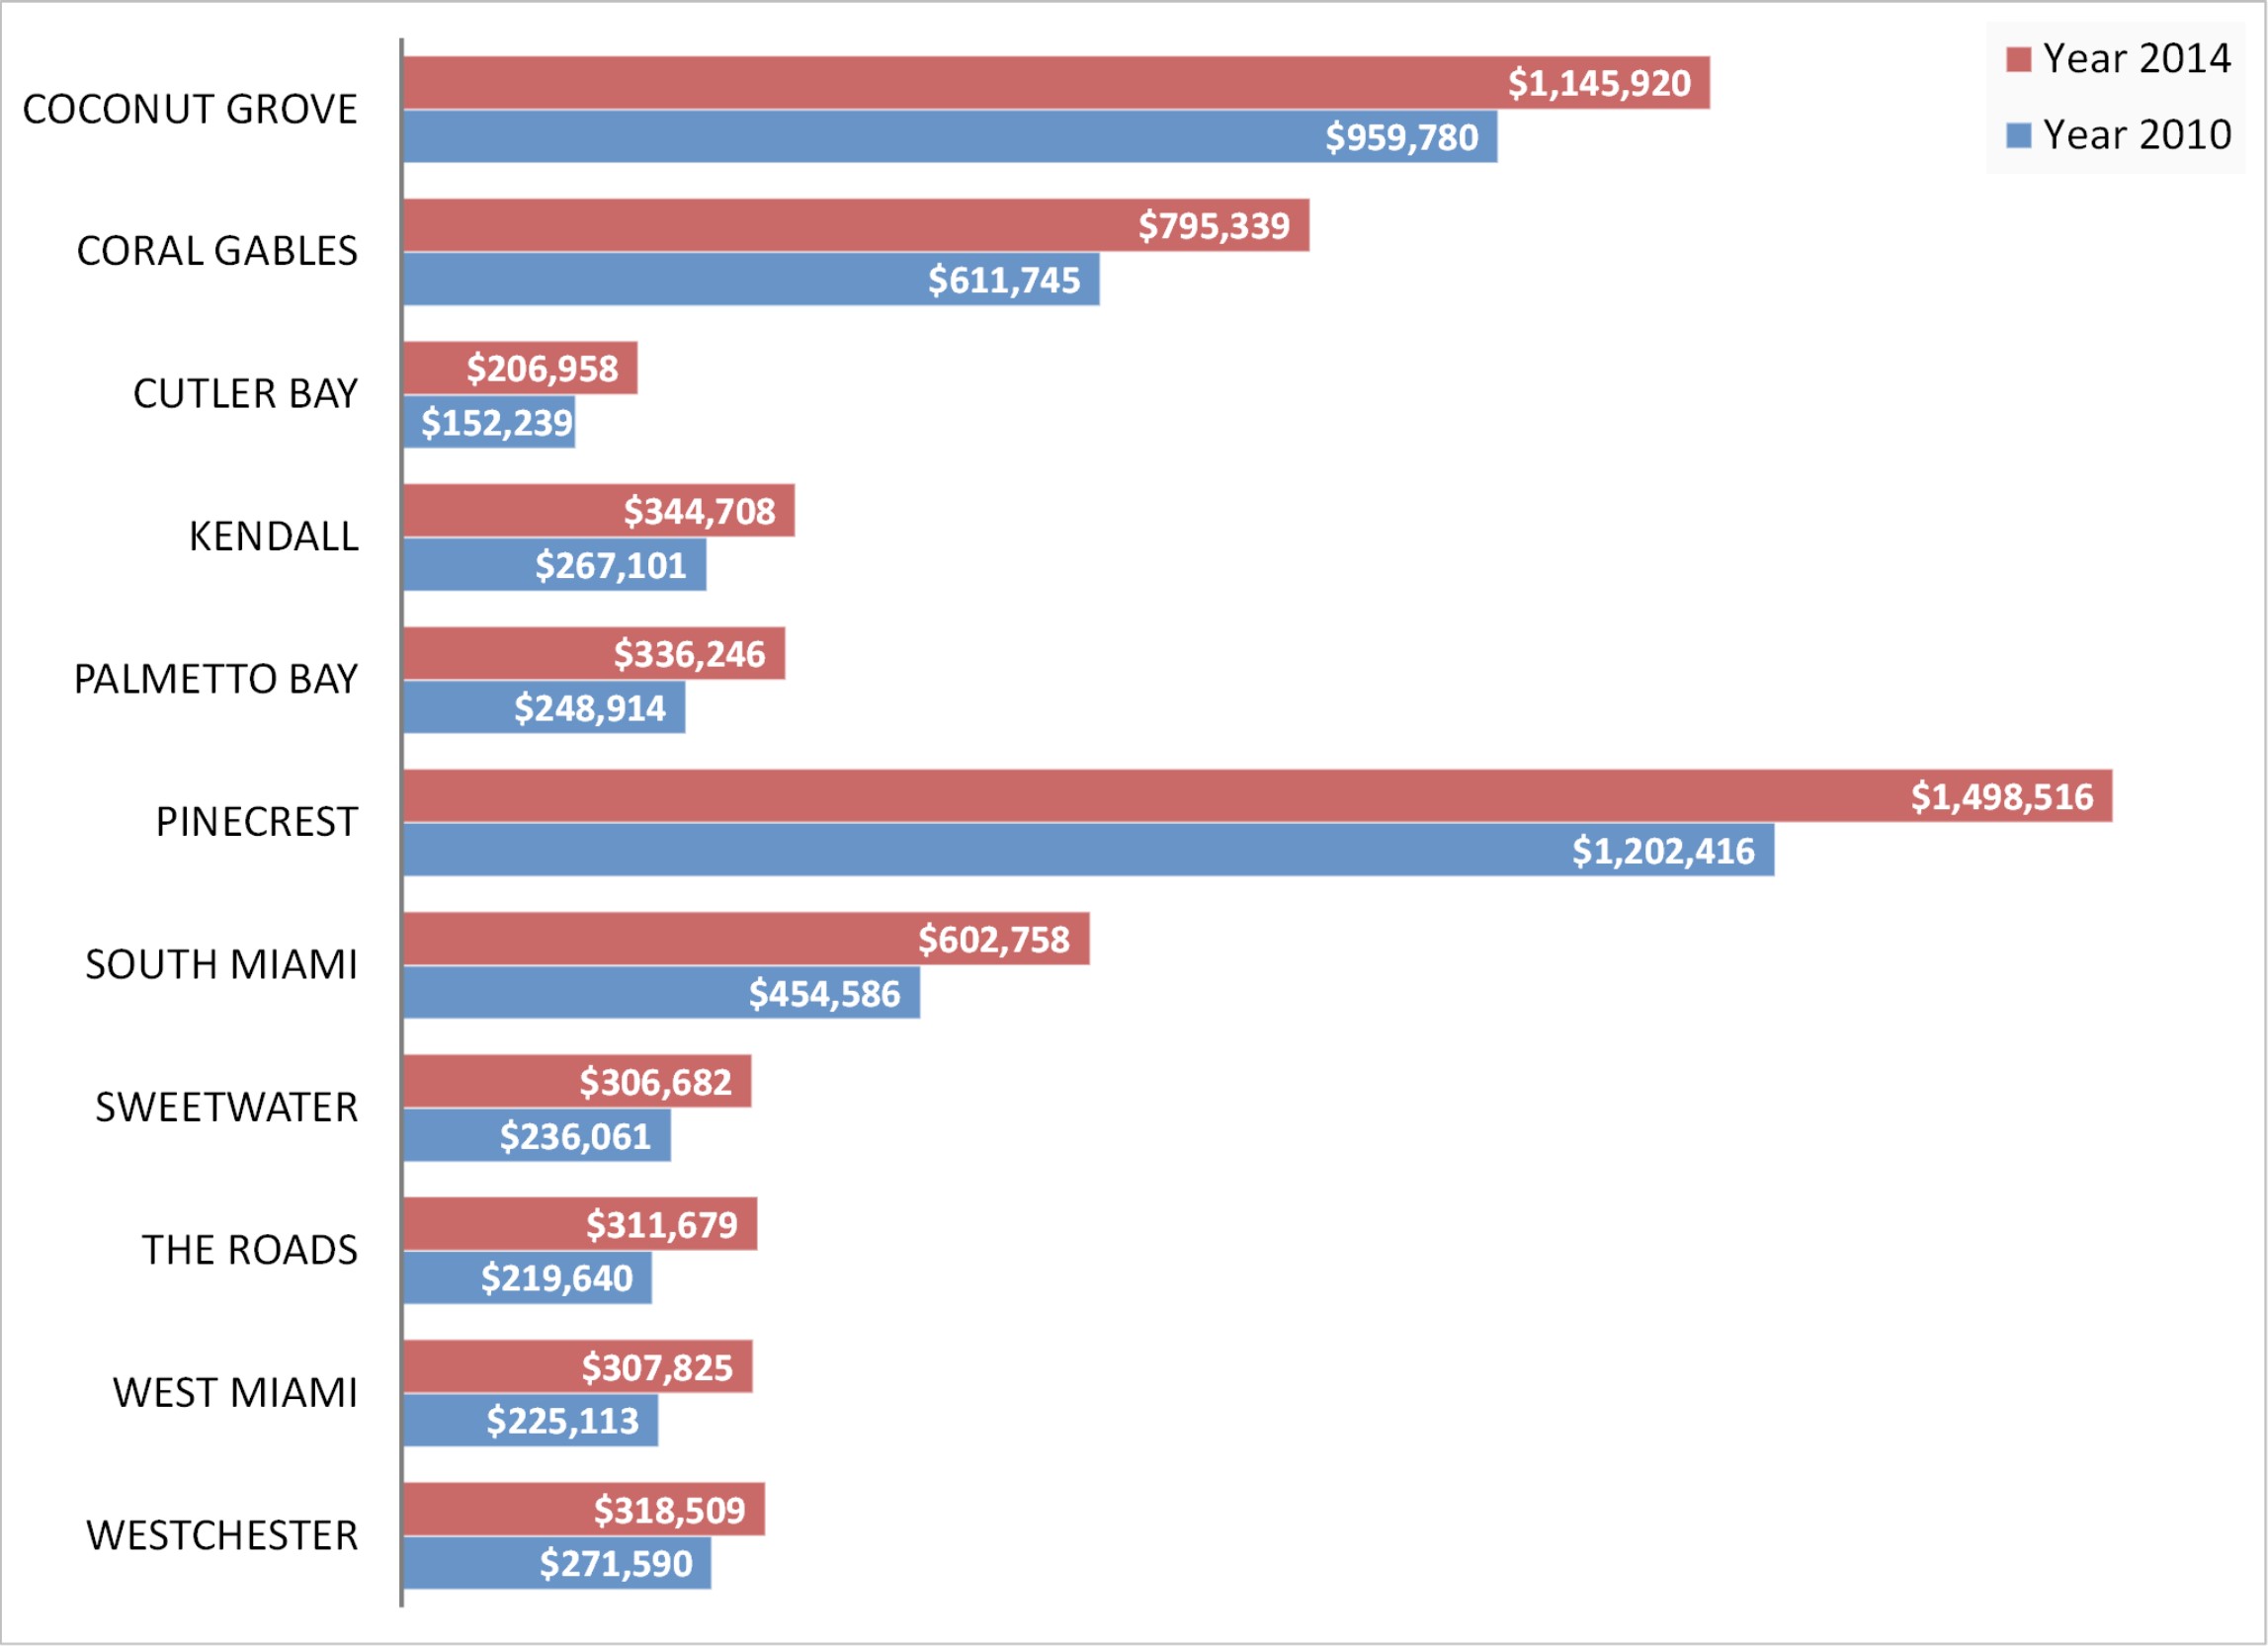
Average Home Price – Single Family – Year-to-date June 2010 vs Year-to-date June 2014 – Below graph details the comparison between the average home price in 2010 versus 2014 by city.
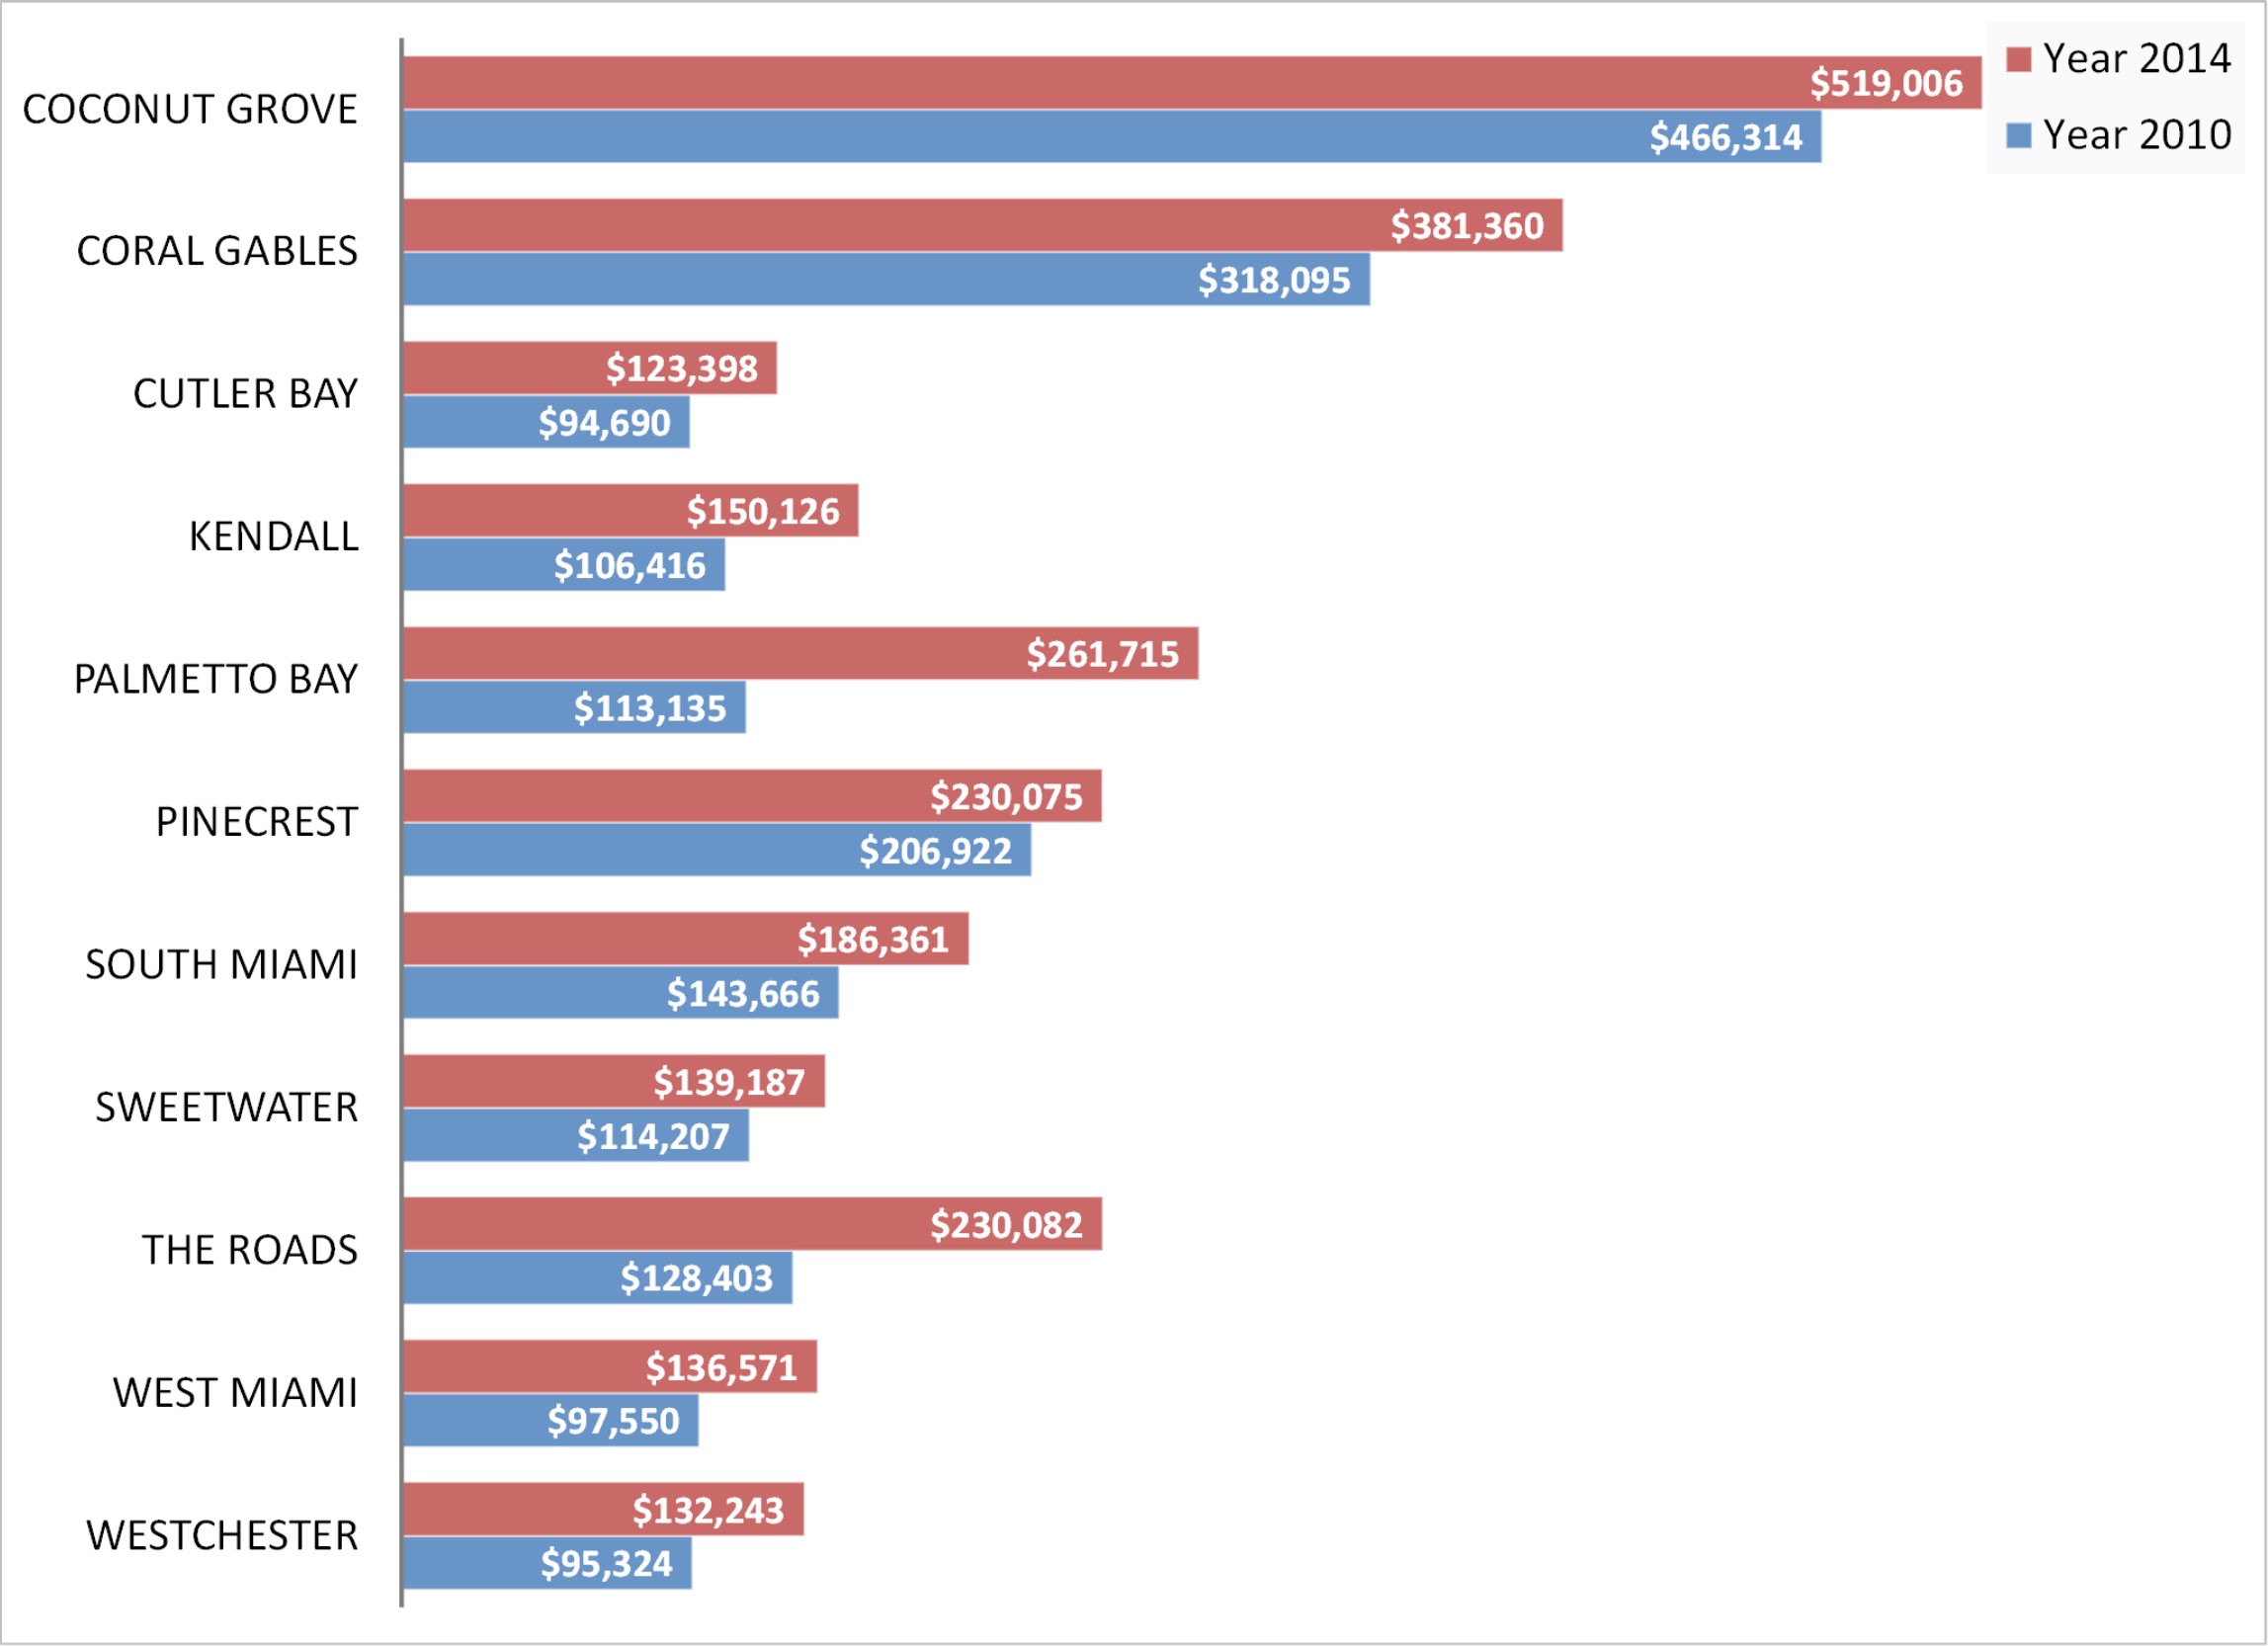
Average Home Price – Condo/Town Home – Year-to-date June 2010 vs Year-to-date June 2014 – Below graph details the comparison between the average home price in 2010 versus 2014 by city.
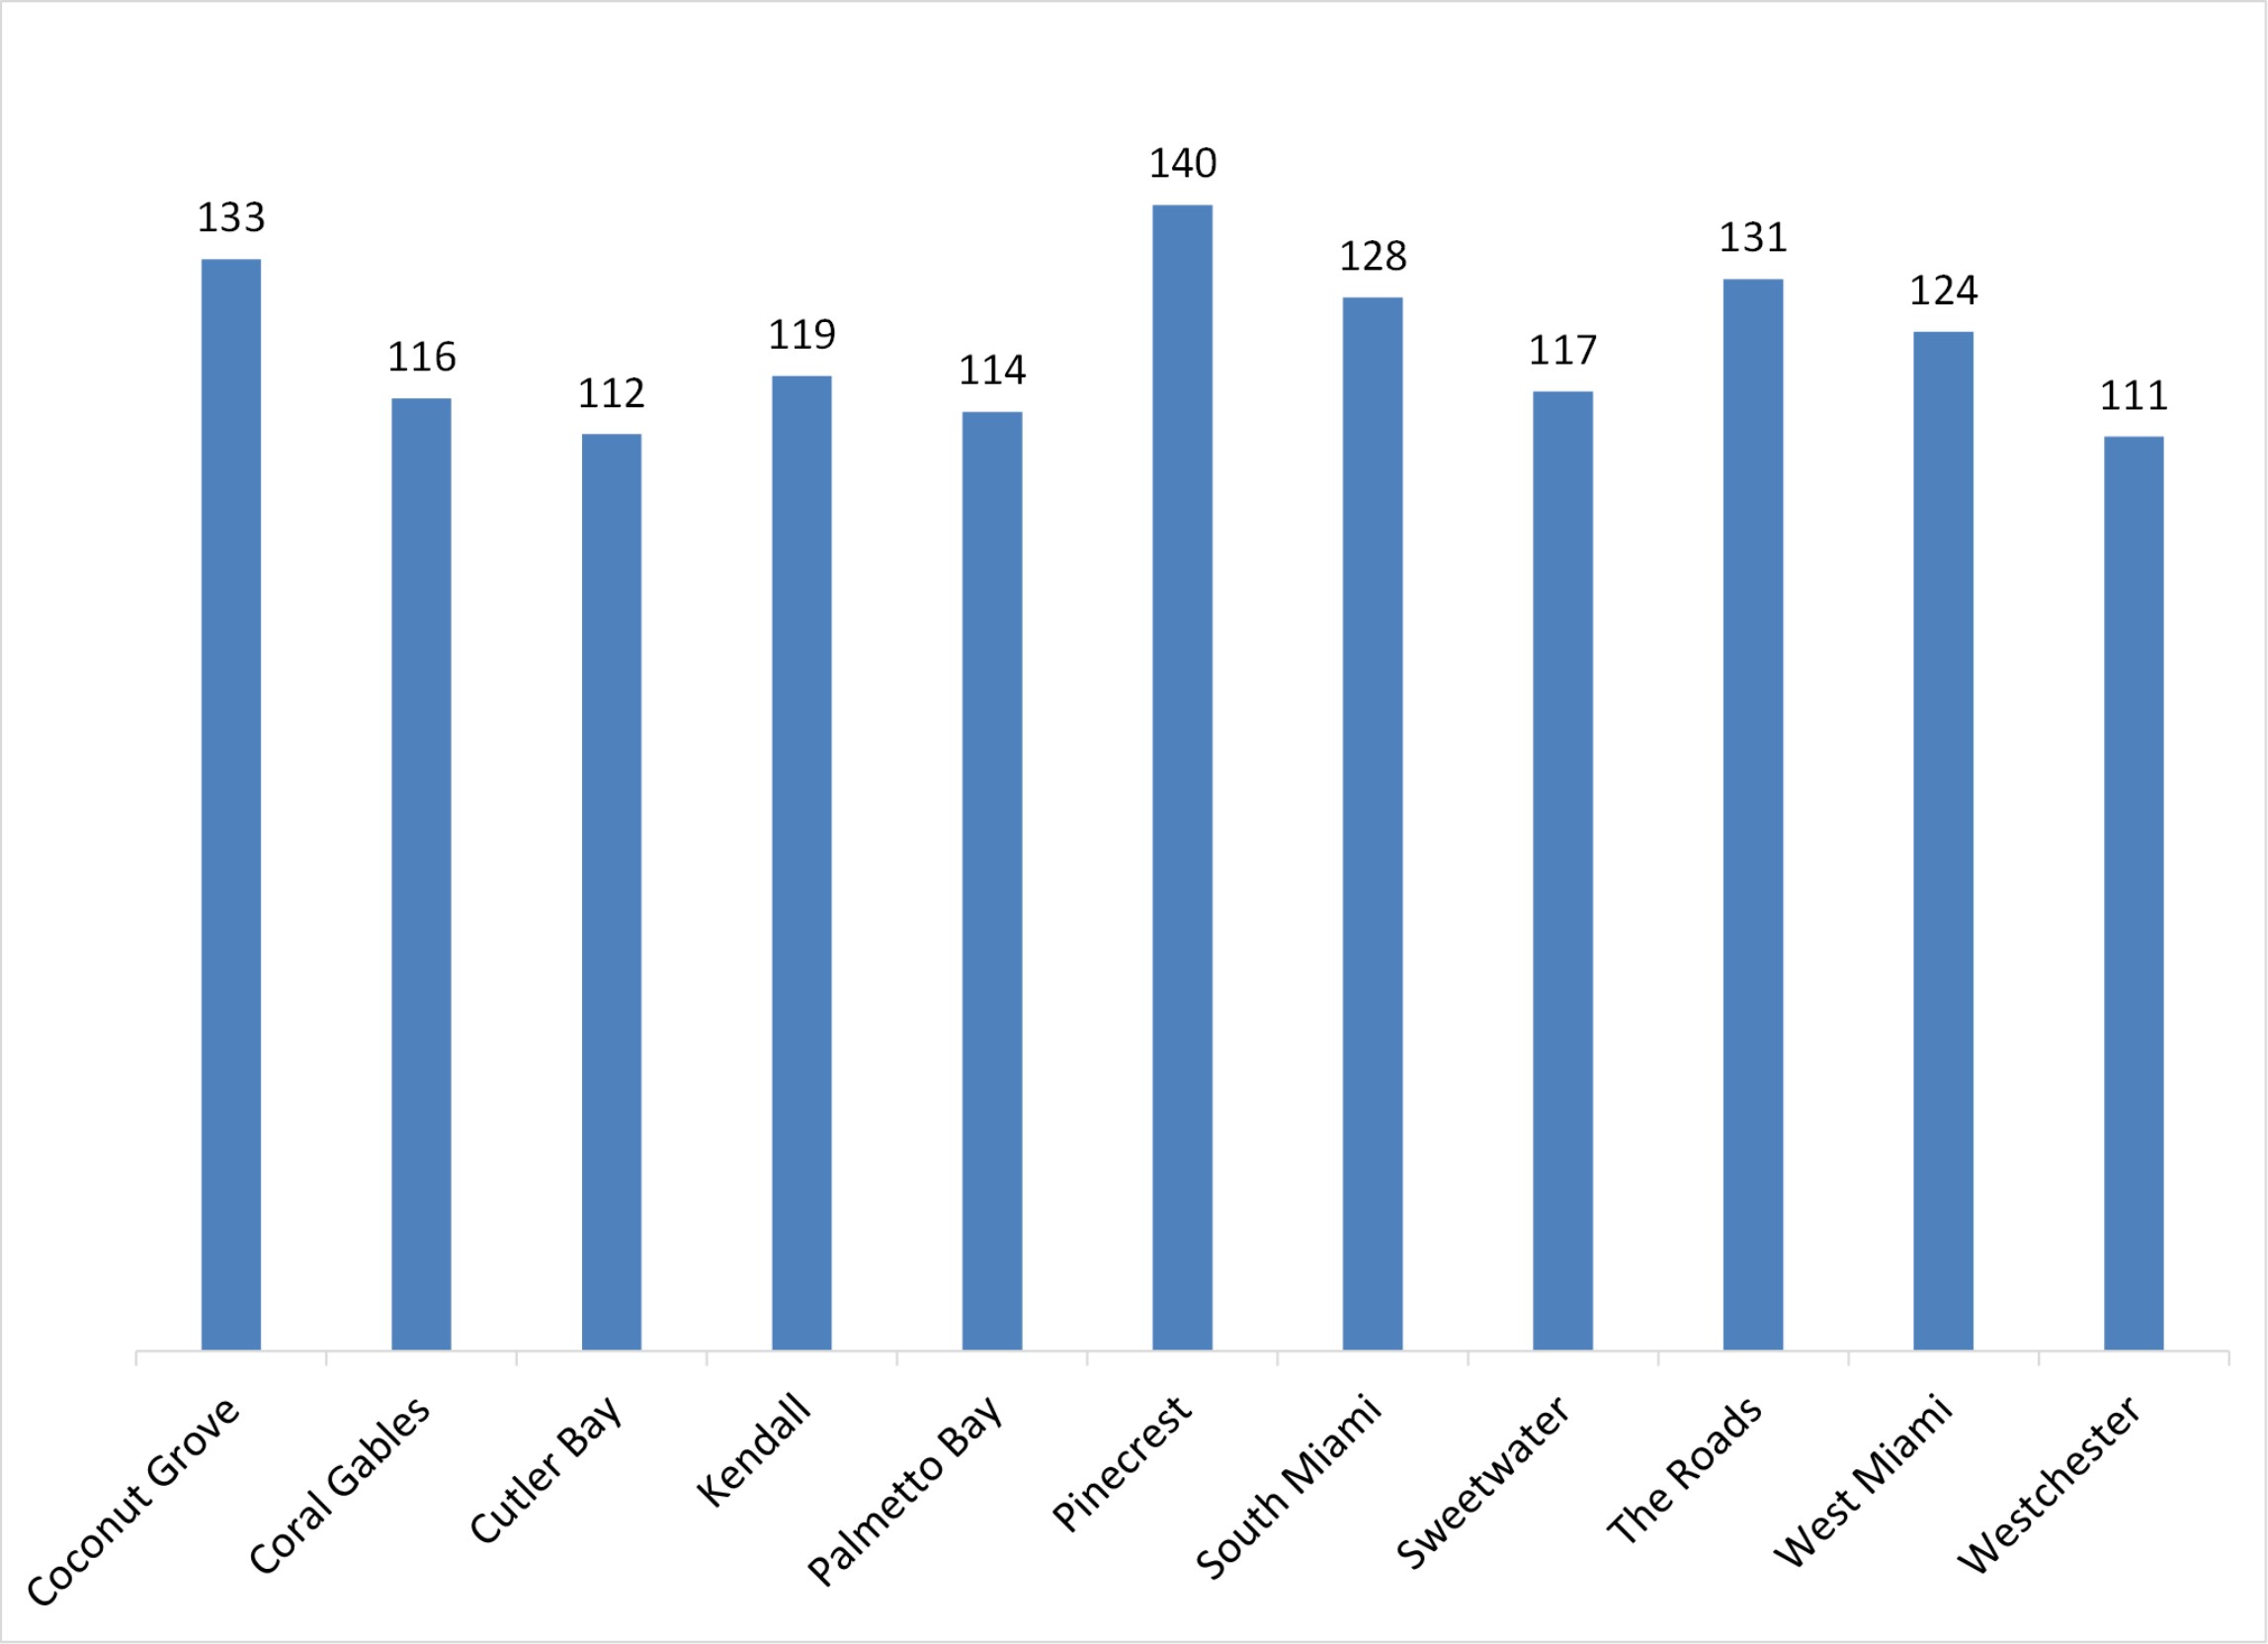
Days On Market or DOM – Single Family – Year-to-date June 2014 – The below chart shows the number of days a property stays in the market for sale until it is sold.
Days On Market or DOM – Condo/Town Home – Year-to-date June 2014 – The below chart shows the number of days a property stays in the market for sale until it is sold.

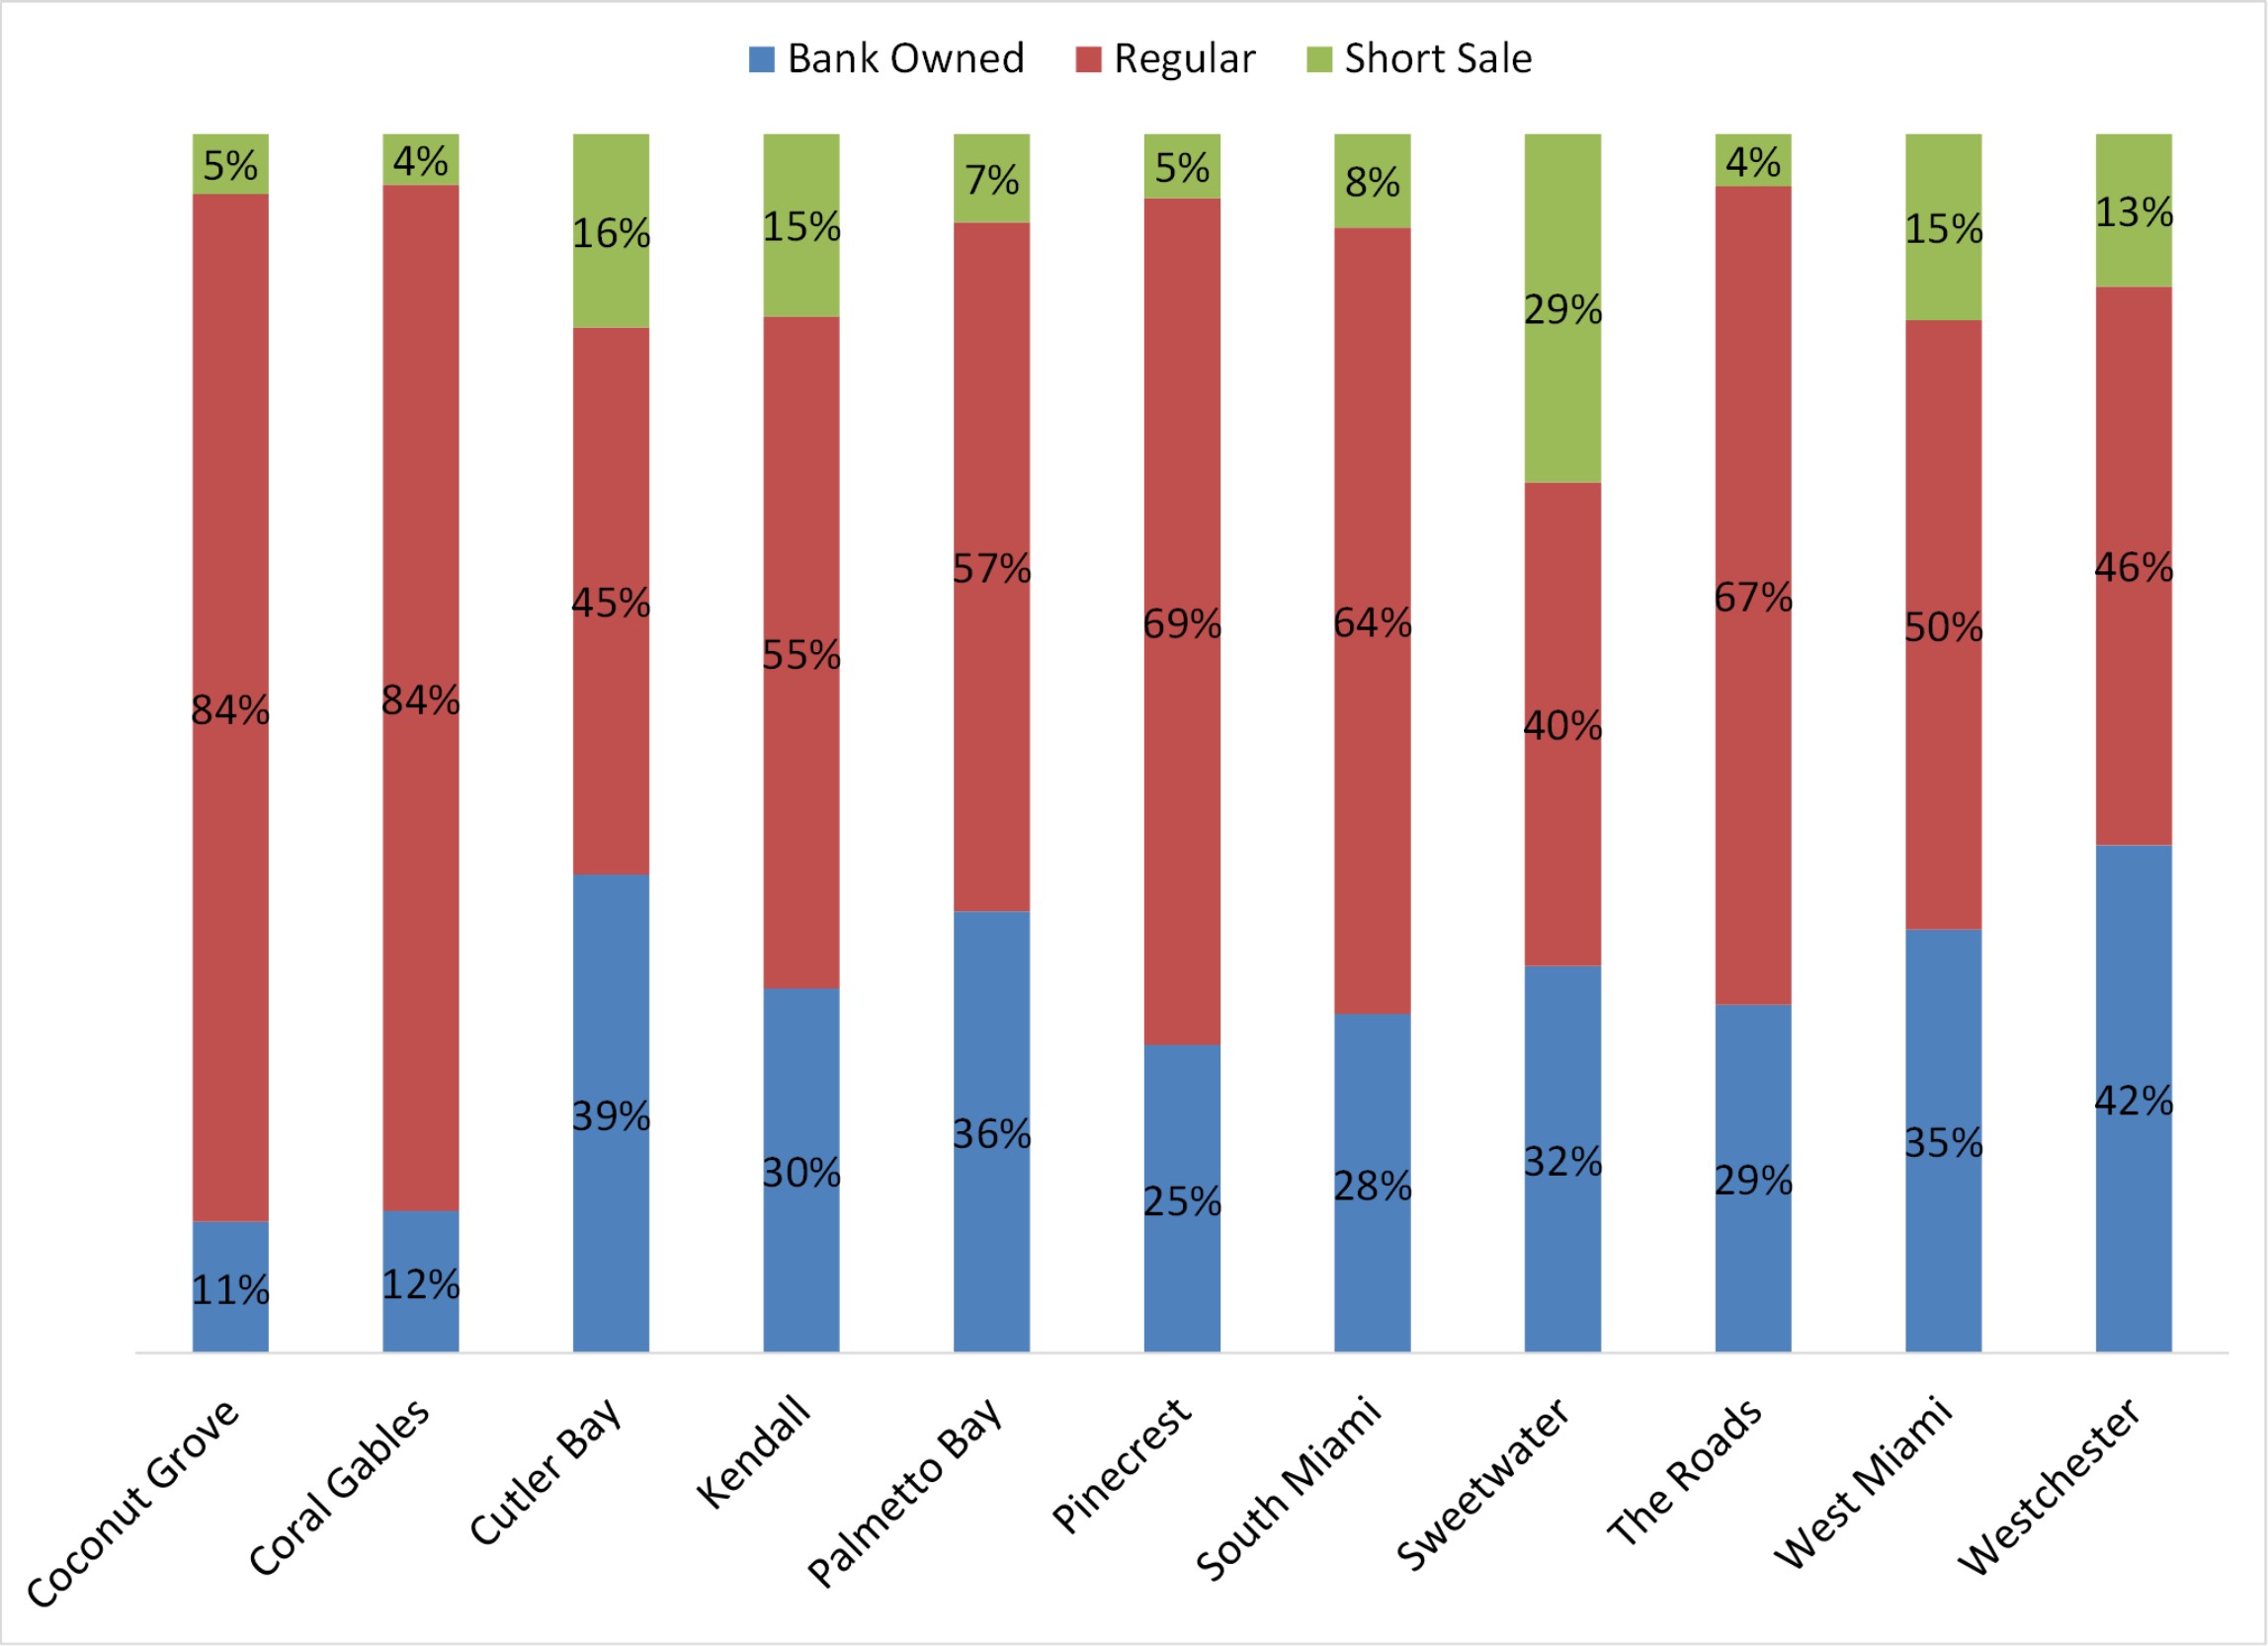
Transaction Type – Single Family – Year-to-date June 2014 – The below graph details the type of sales taking place by city.

Transaction Type – Condo/Town Home – Year-to-date June 2014 – The below graph details the type of sales taking place by city.