Closed sales down, inventory down, and prices up. All indicators pointing to a healthy seller’s market compared to last year. Taking “risk” into consideration, real estate remains one the most solid investments compared to stocks, bonds, etc.
FYI: data analyzed in this blog post is for single family homes only.
How’s the market?
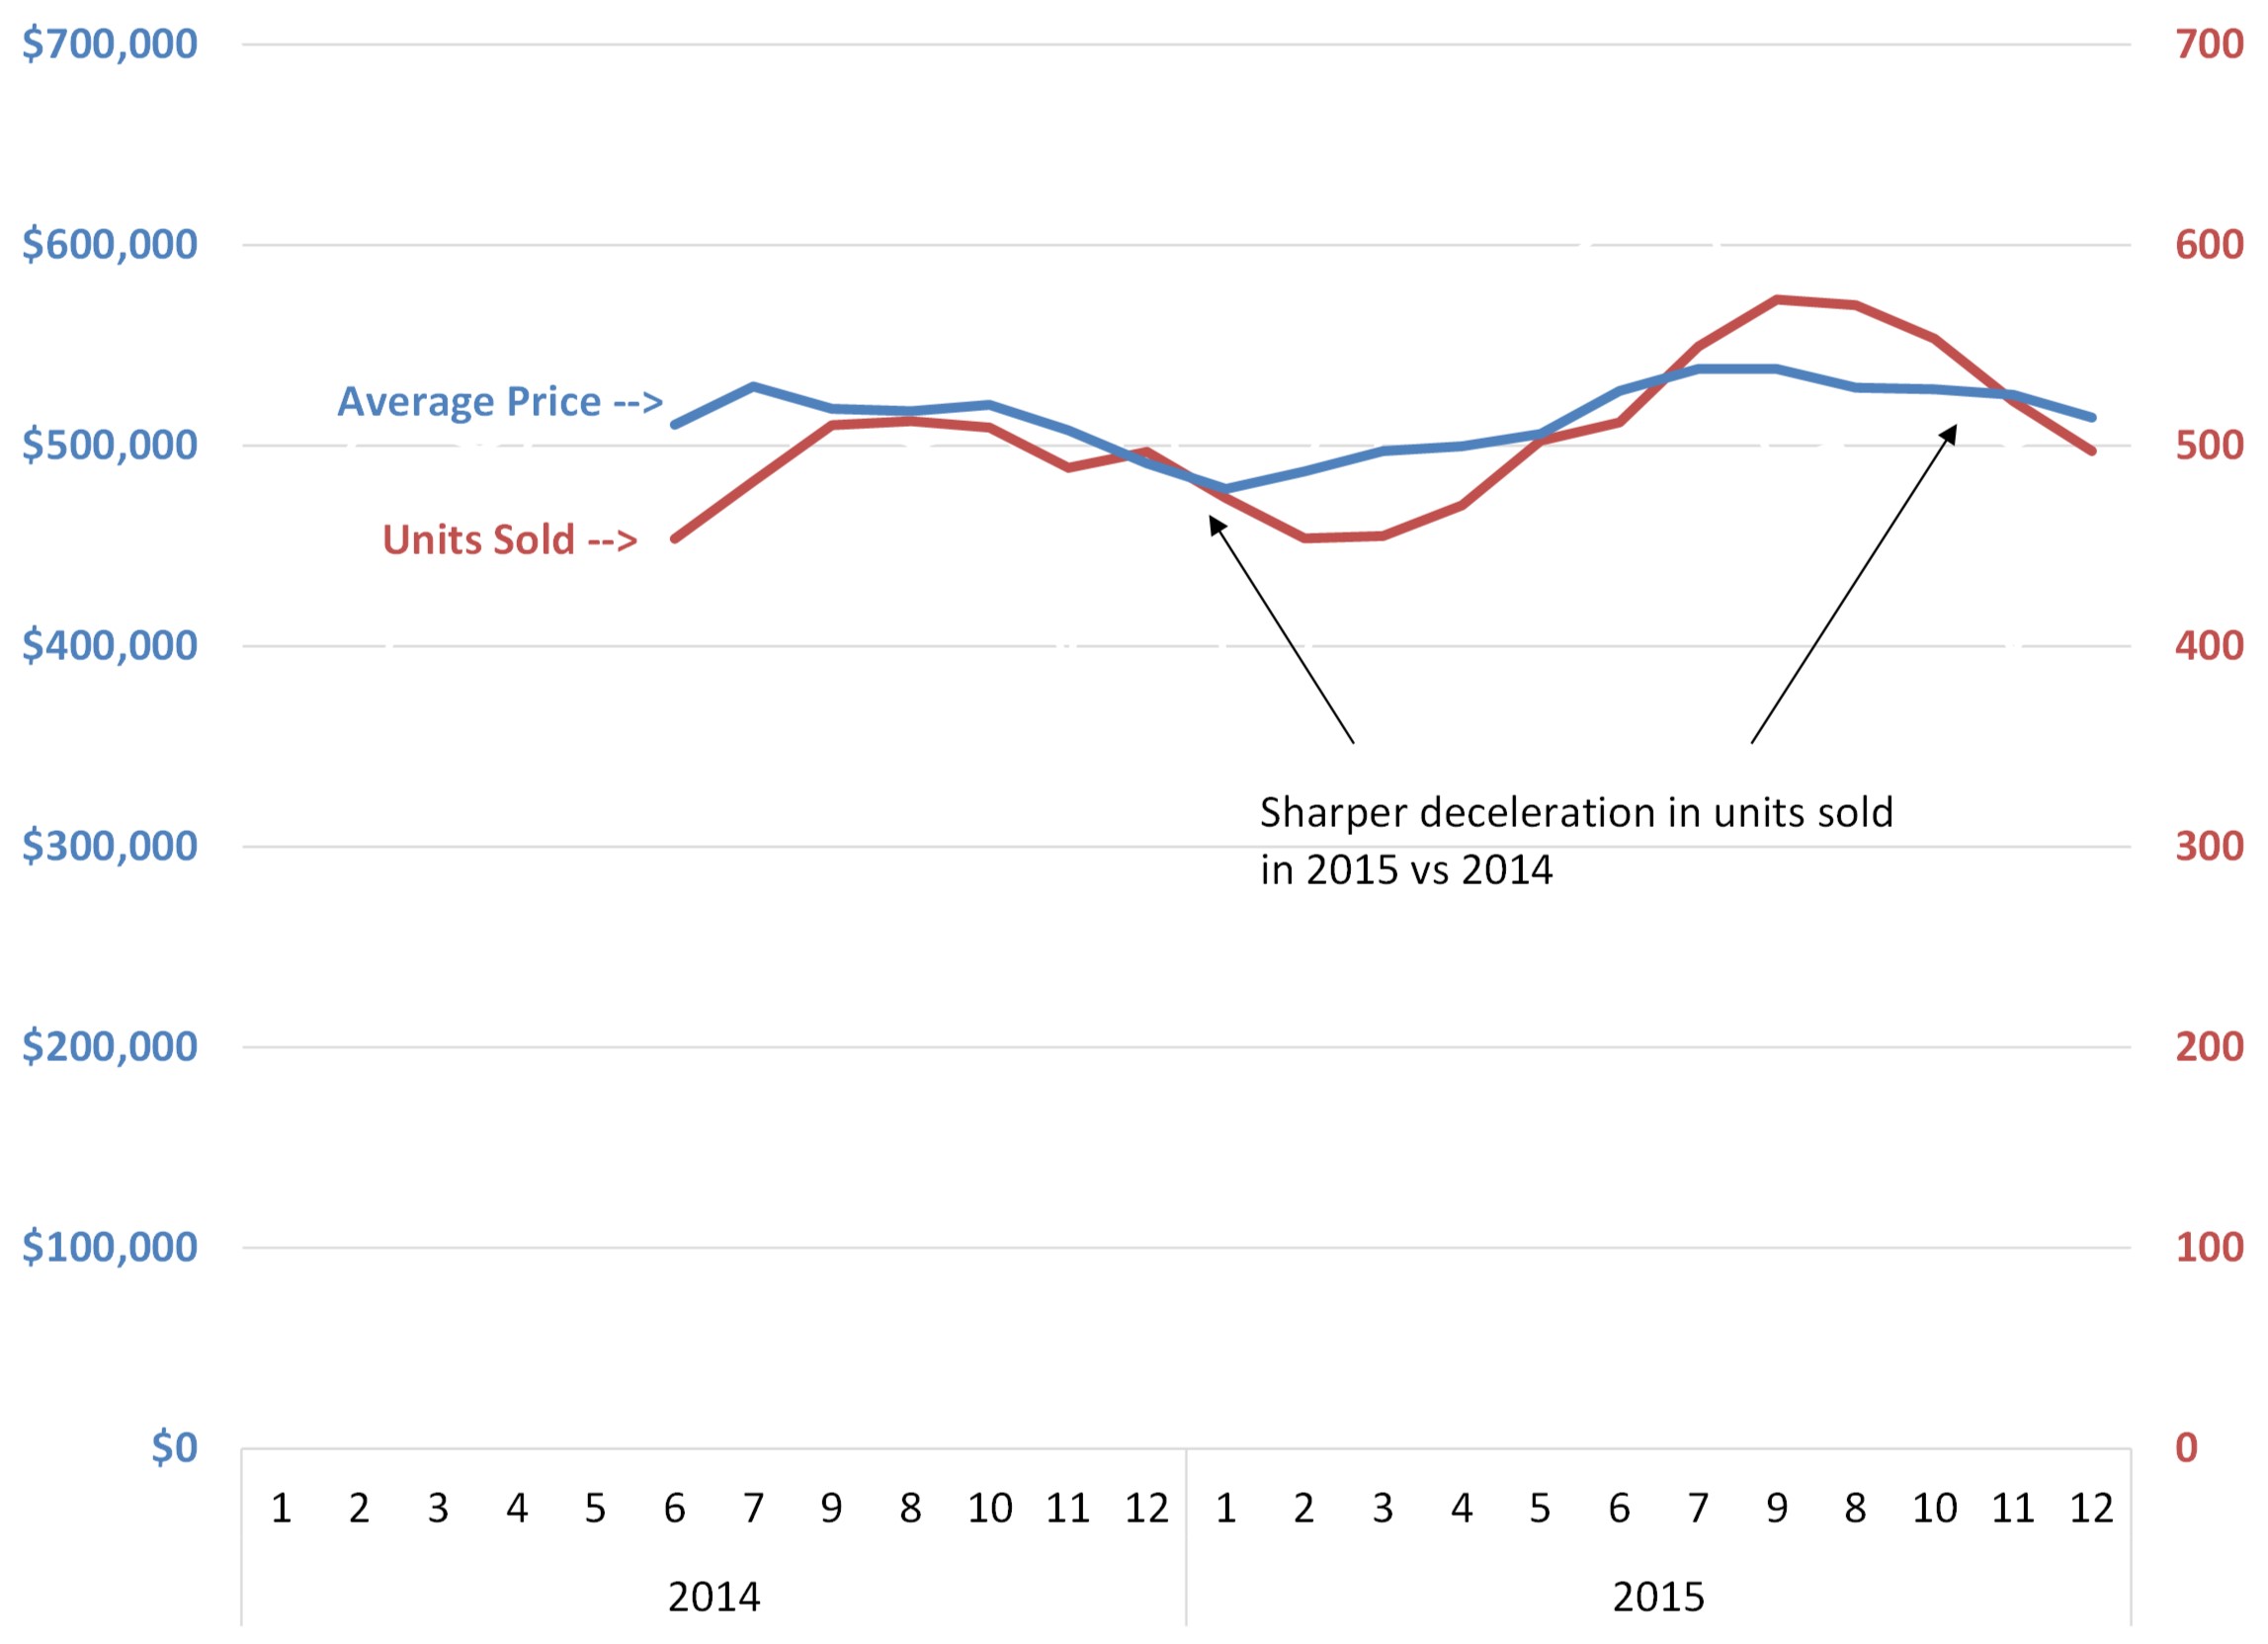
Prices remain unchanged and sales volume (number of homes sold) is slower than usual. Although this trend is expected as we are just heading out of the holiday season – when most homeowners keep their property off the market – there is a stronger deceleration in units sold at the turn of 2015-2016 when compared to the turn in 2014-2015 (see below graph).
*Above graph represents combined data from Coconut Grove, Coral Gables, Cutler Bay, Kendall, Palmetto Bay, Pinecrest, South Miami, Sweetwater, The Roads, West Miami, and Westchester*
What’s the outlook?
In my opinion, home prices will continue to remain unchanged for the remainder of 2016. Around March or April, volume of sales will take an upturn just like it did in March and April of 2015, but it will not be as significant. This will have no impact in home prices due to economically healthier home owners that are able to hold on to their homes till prices go up.
In my opinion, it will not make a difference weather you sell now or at any time during the year since prices are expected to remain status quo. However, should your home-carrying expenses (mortgage payments, taxes, insurance, etc) exceed any appreciation in price in your neighborhood, then it may be a good time to sell.
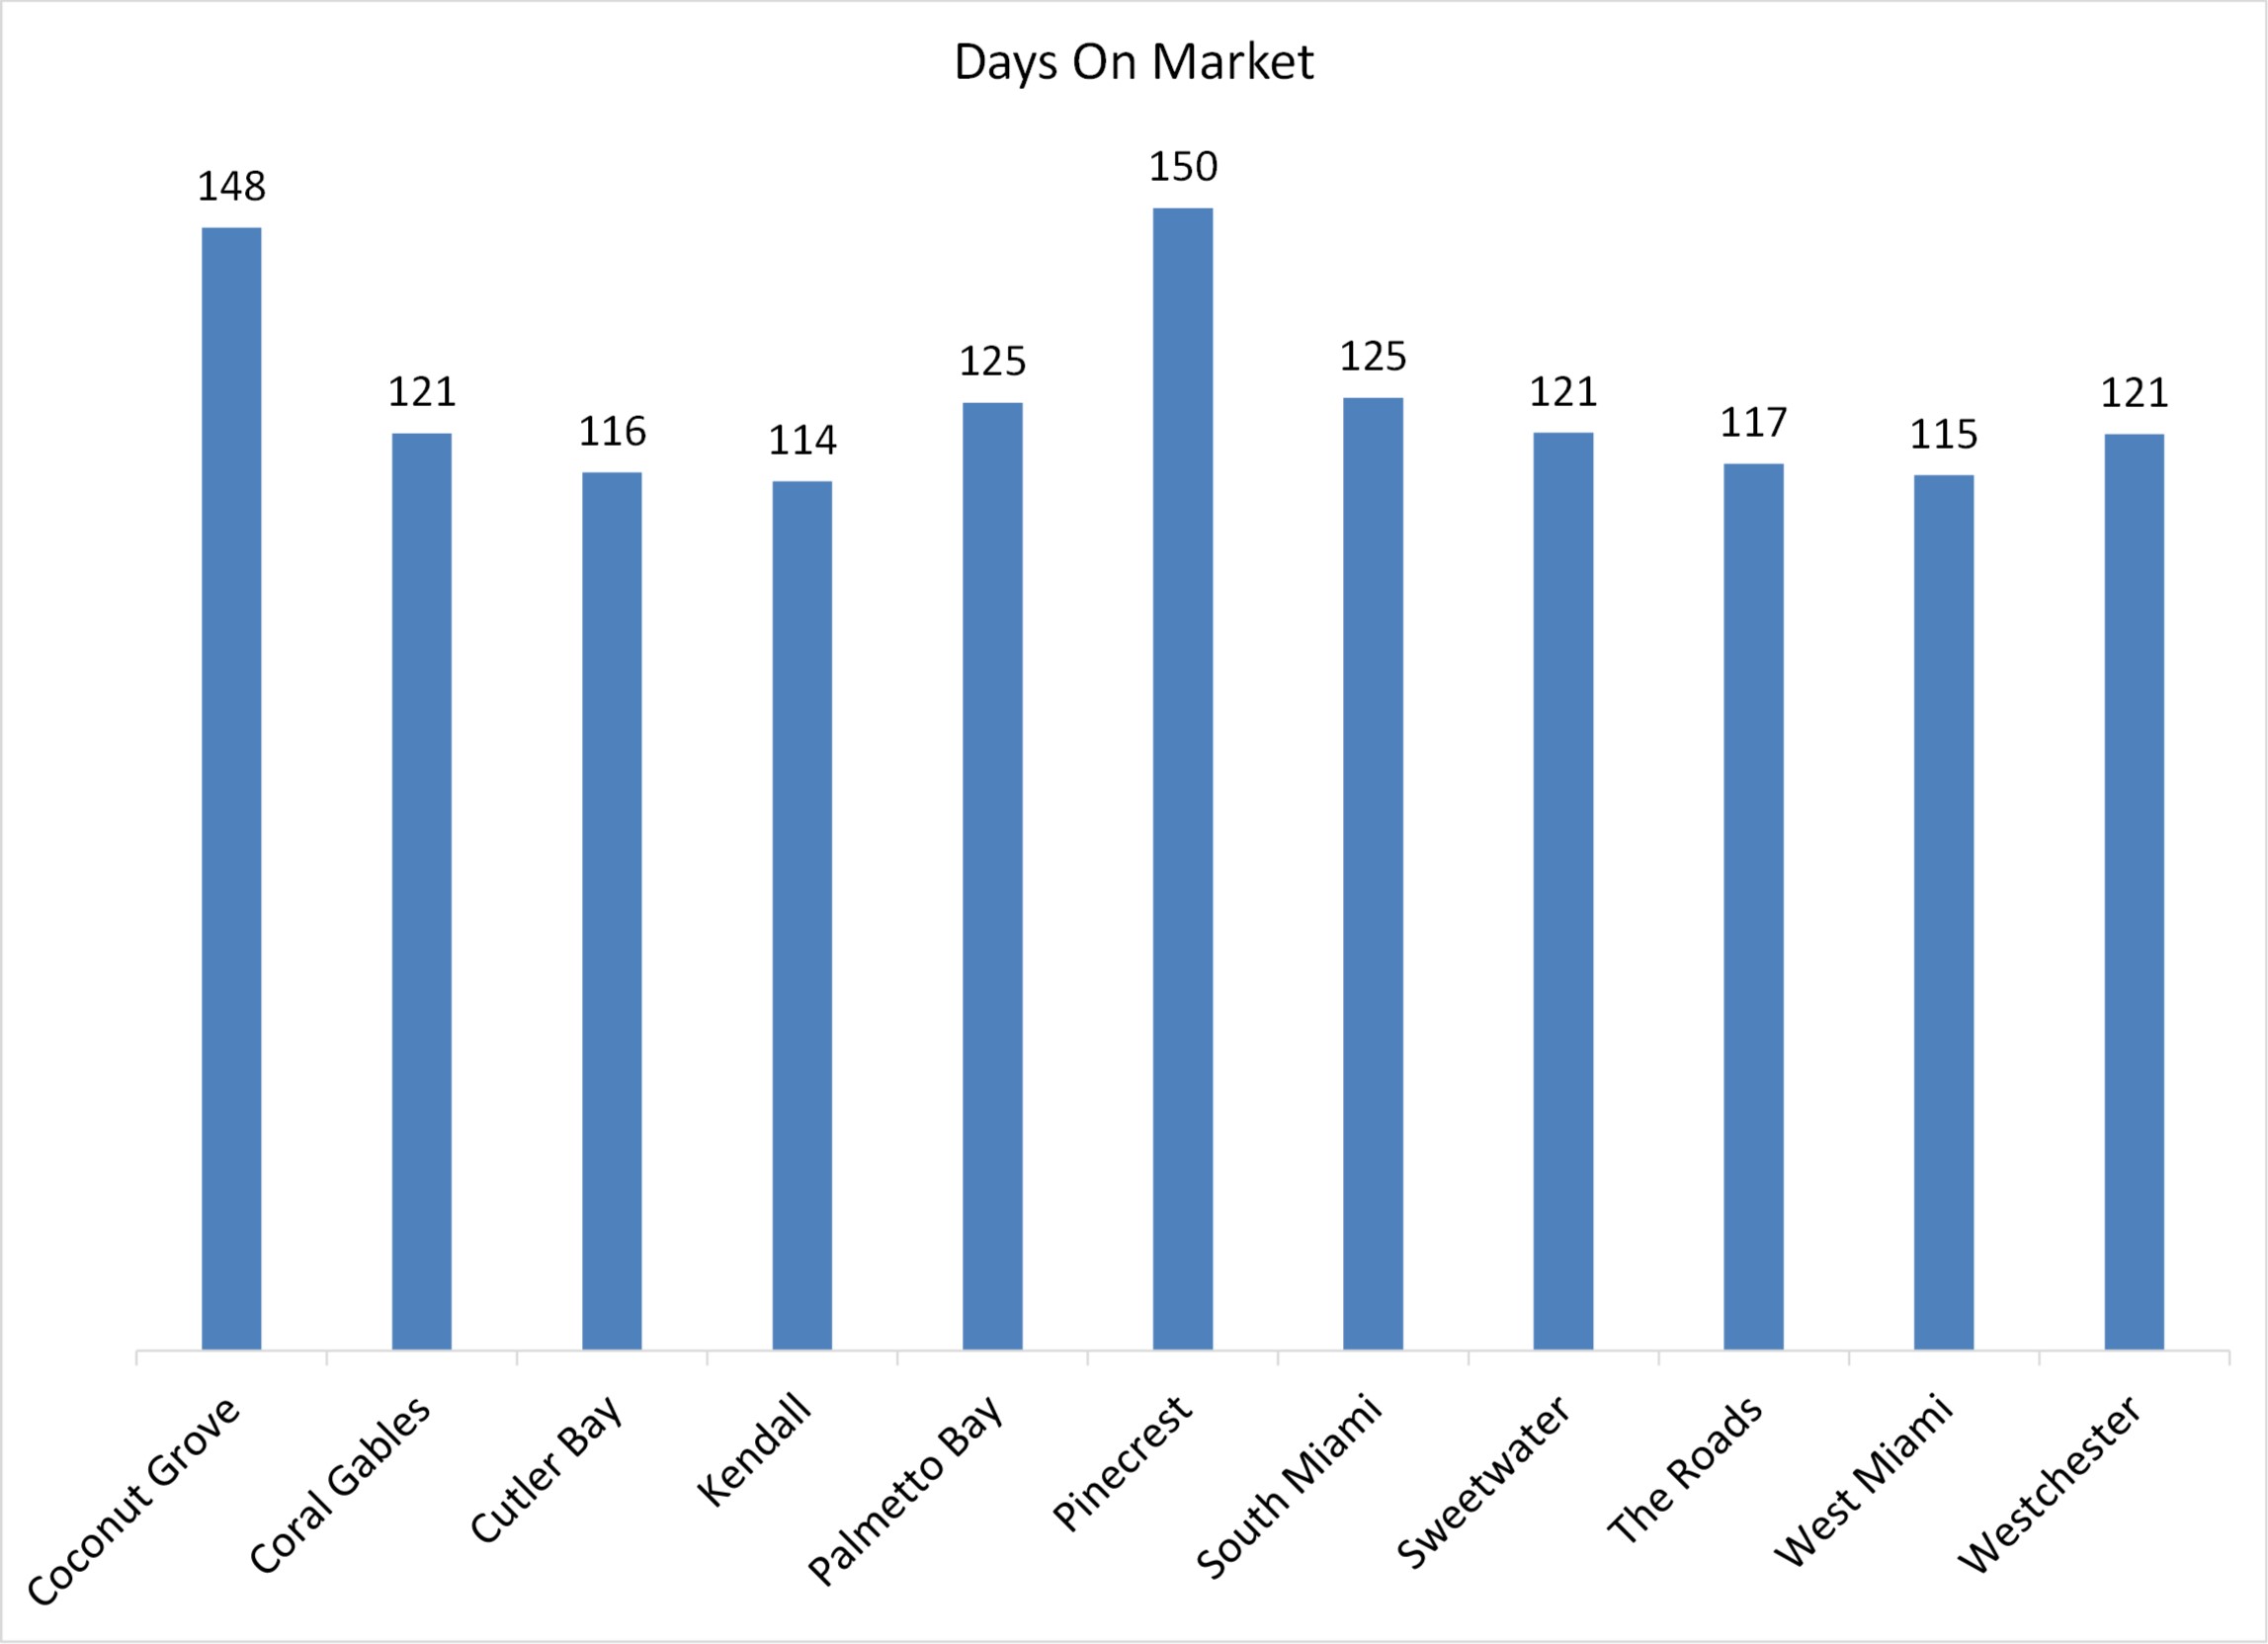
On average, 122 days or 4 months. See below graph for the average number of days it will take your home to sell in your neighborhood.
How’s the foreclosure market doing?
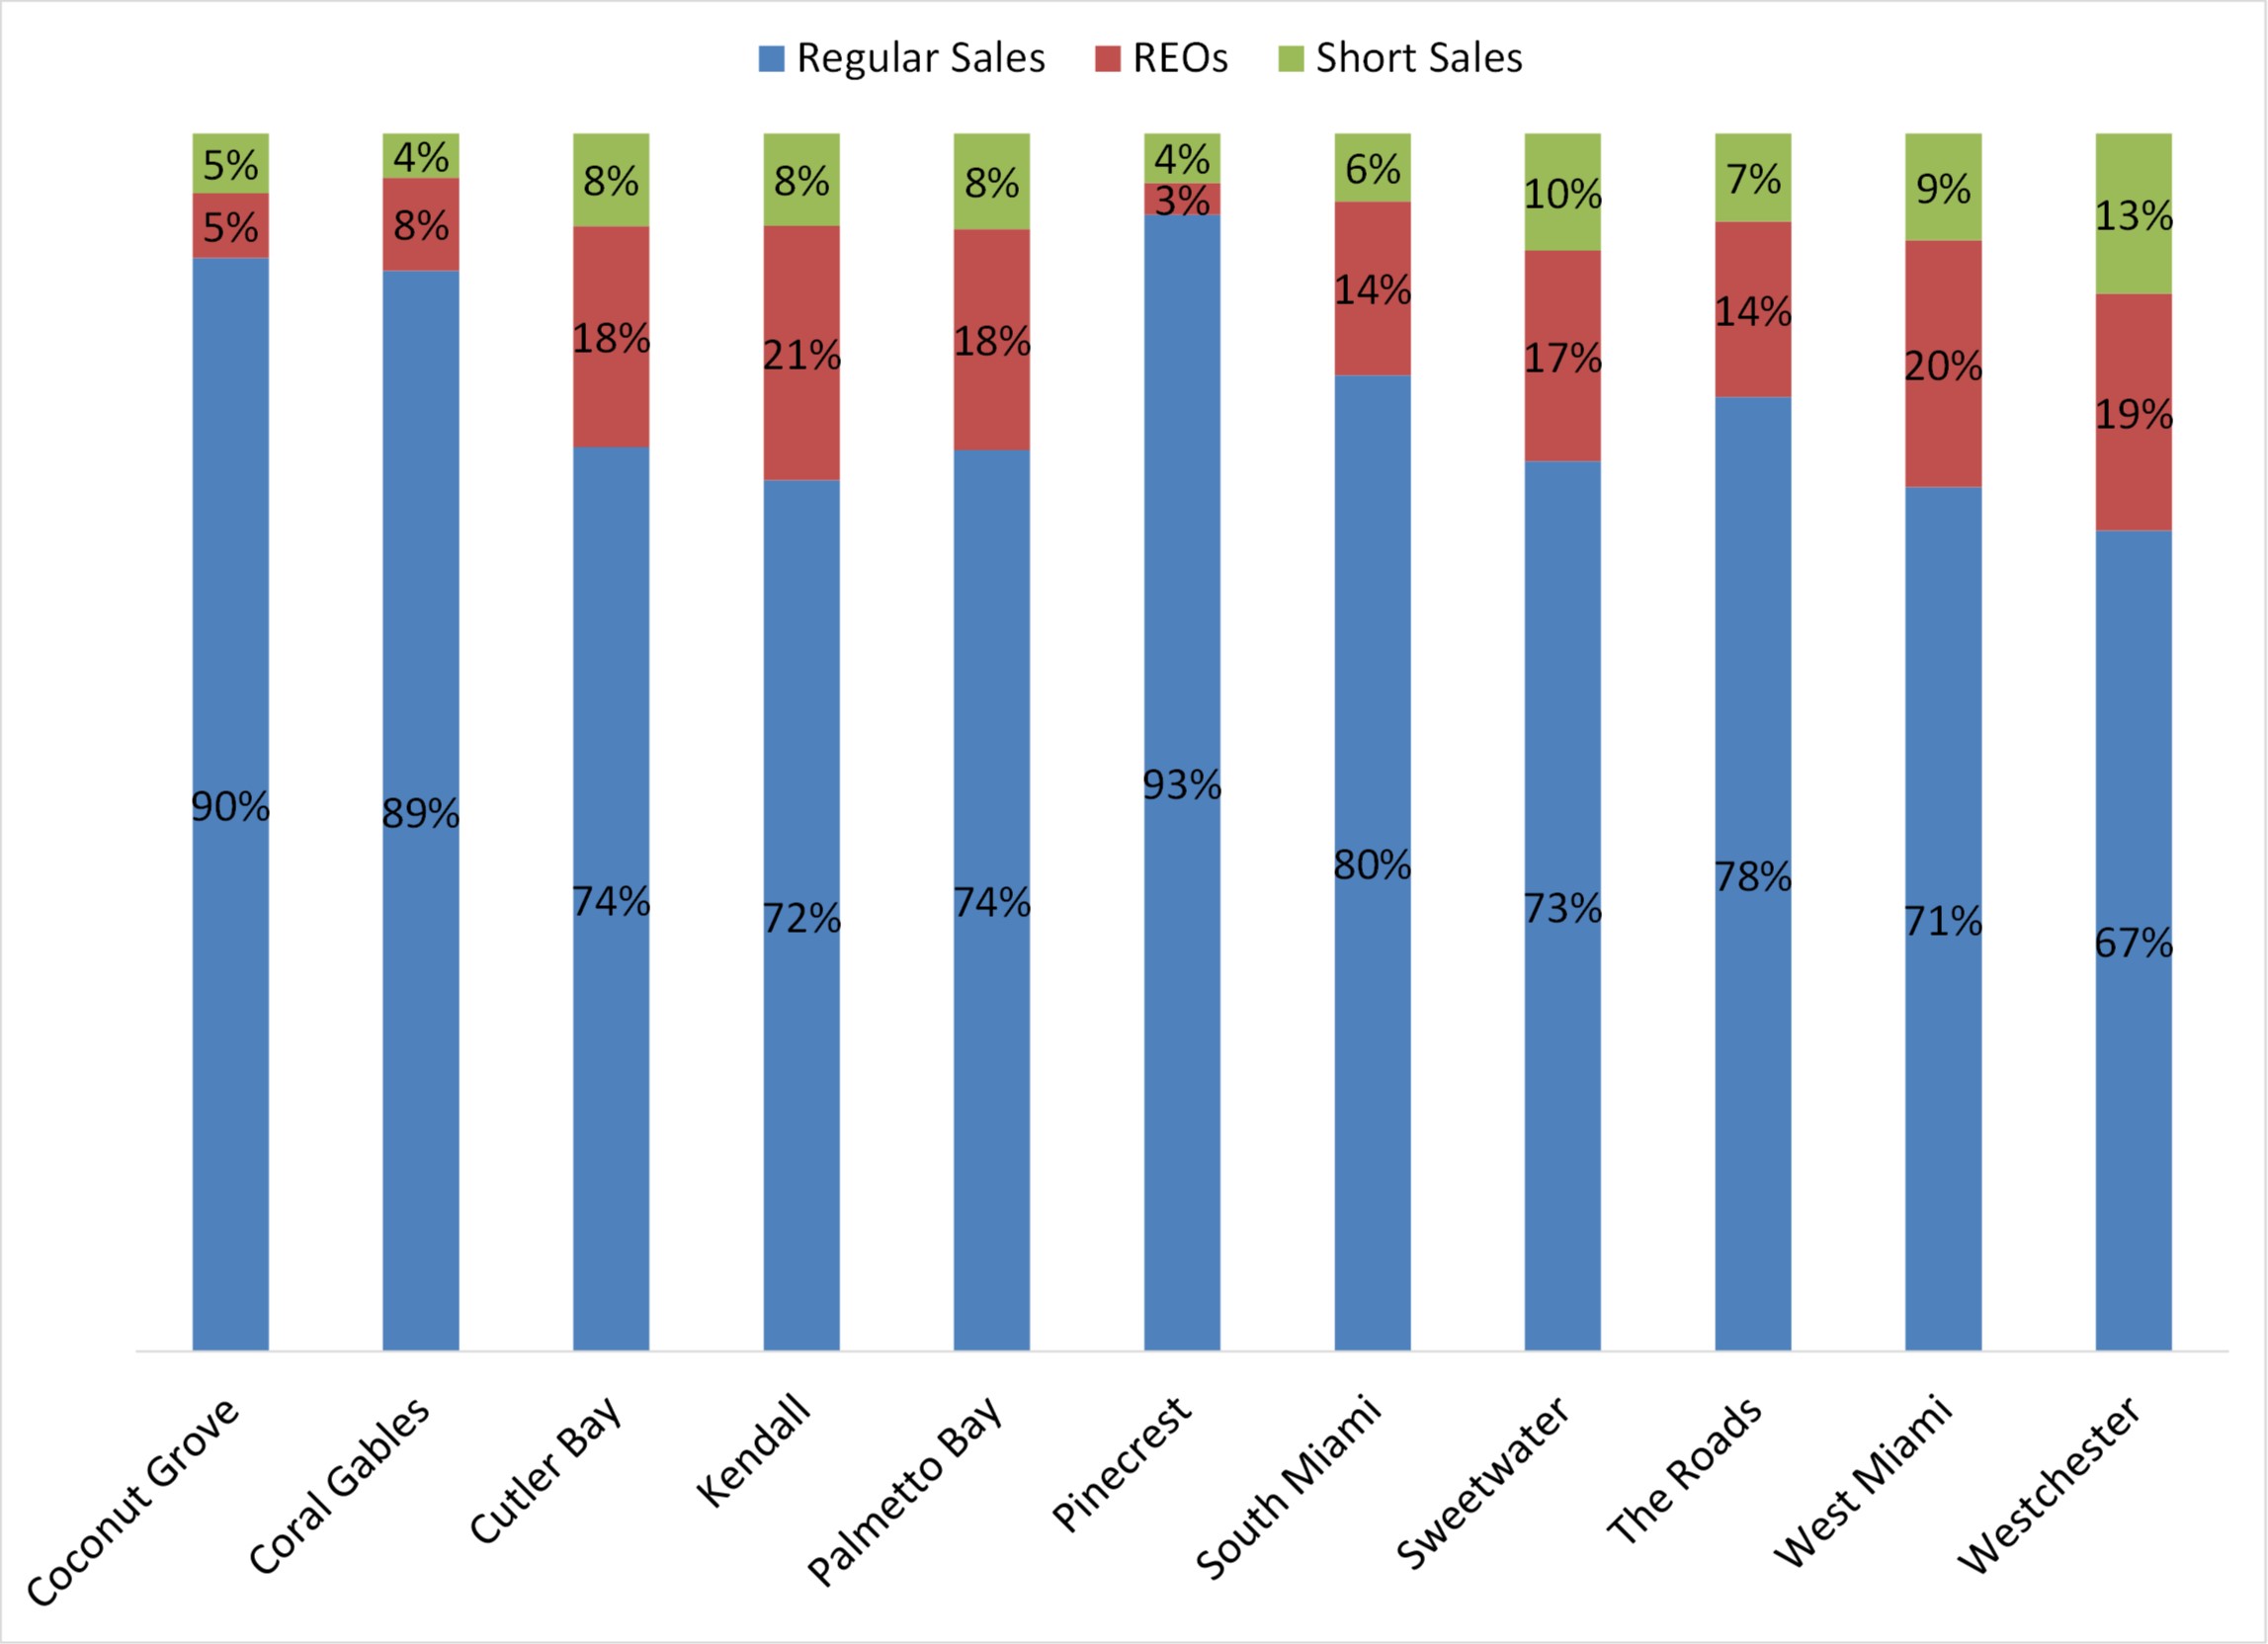
Not good. And this is good news considering such market makes up less than 20% of sold homes. See below graph to see how the foreclosure market is doing in your neighborhood.