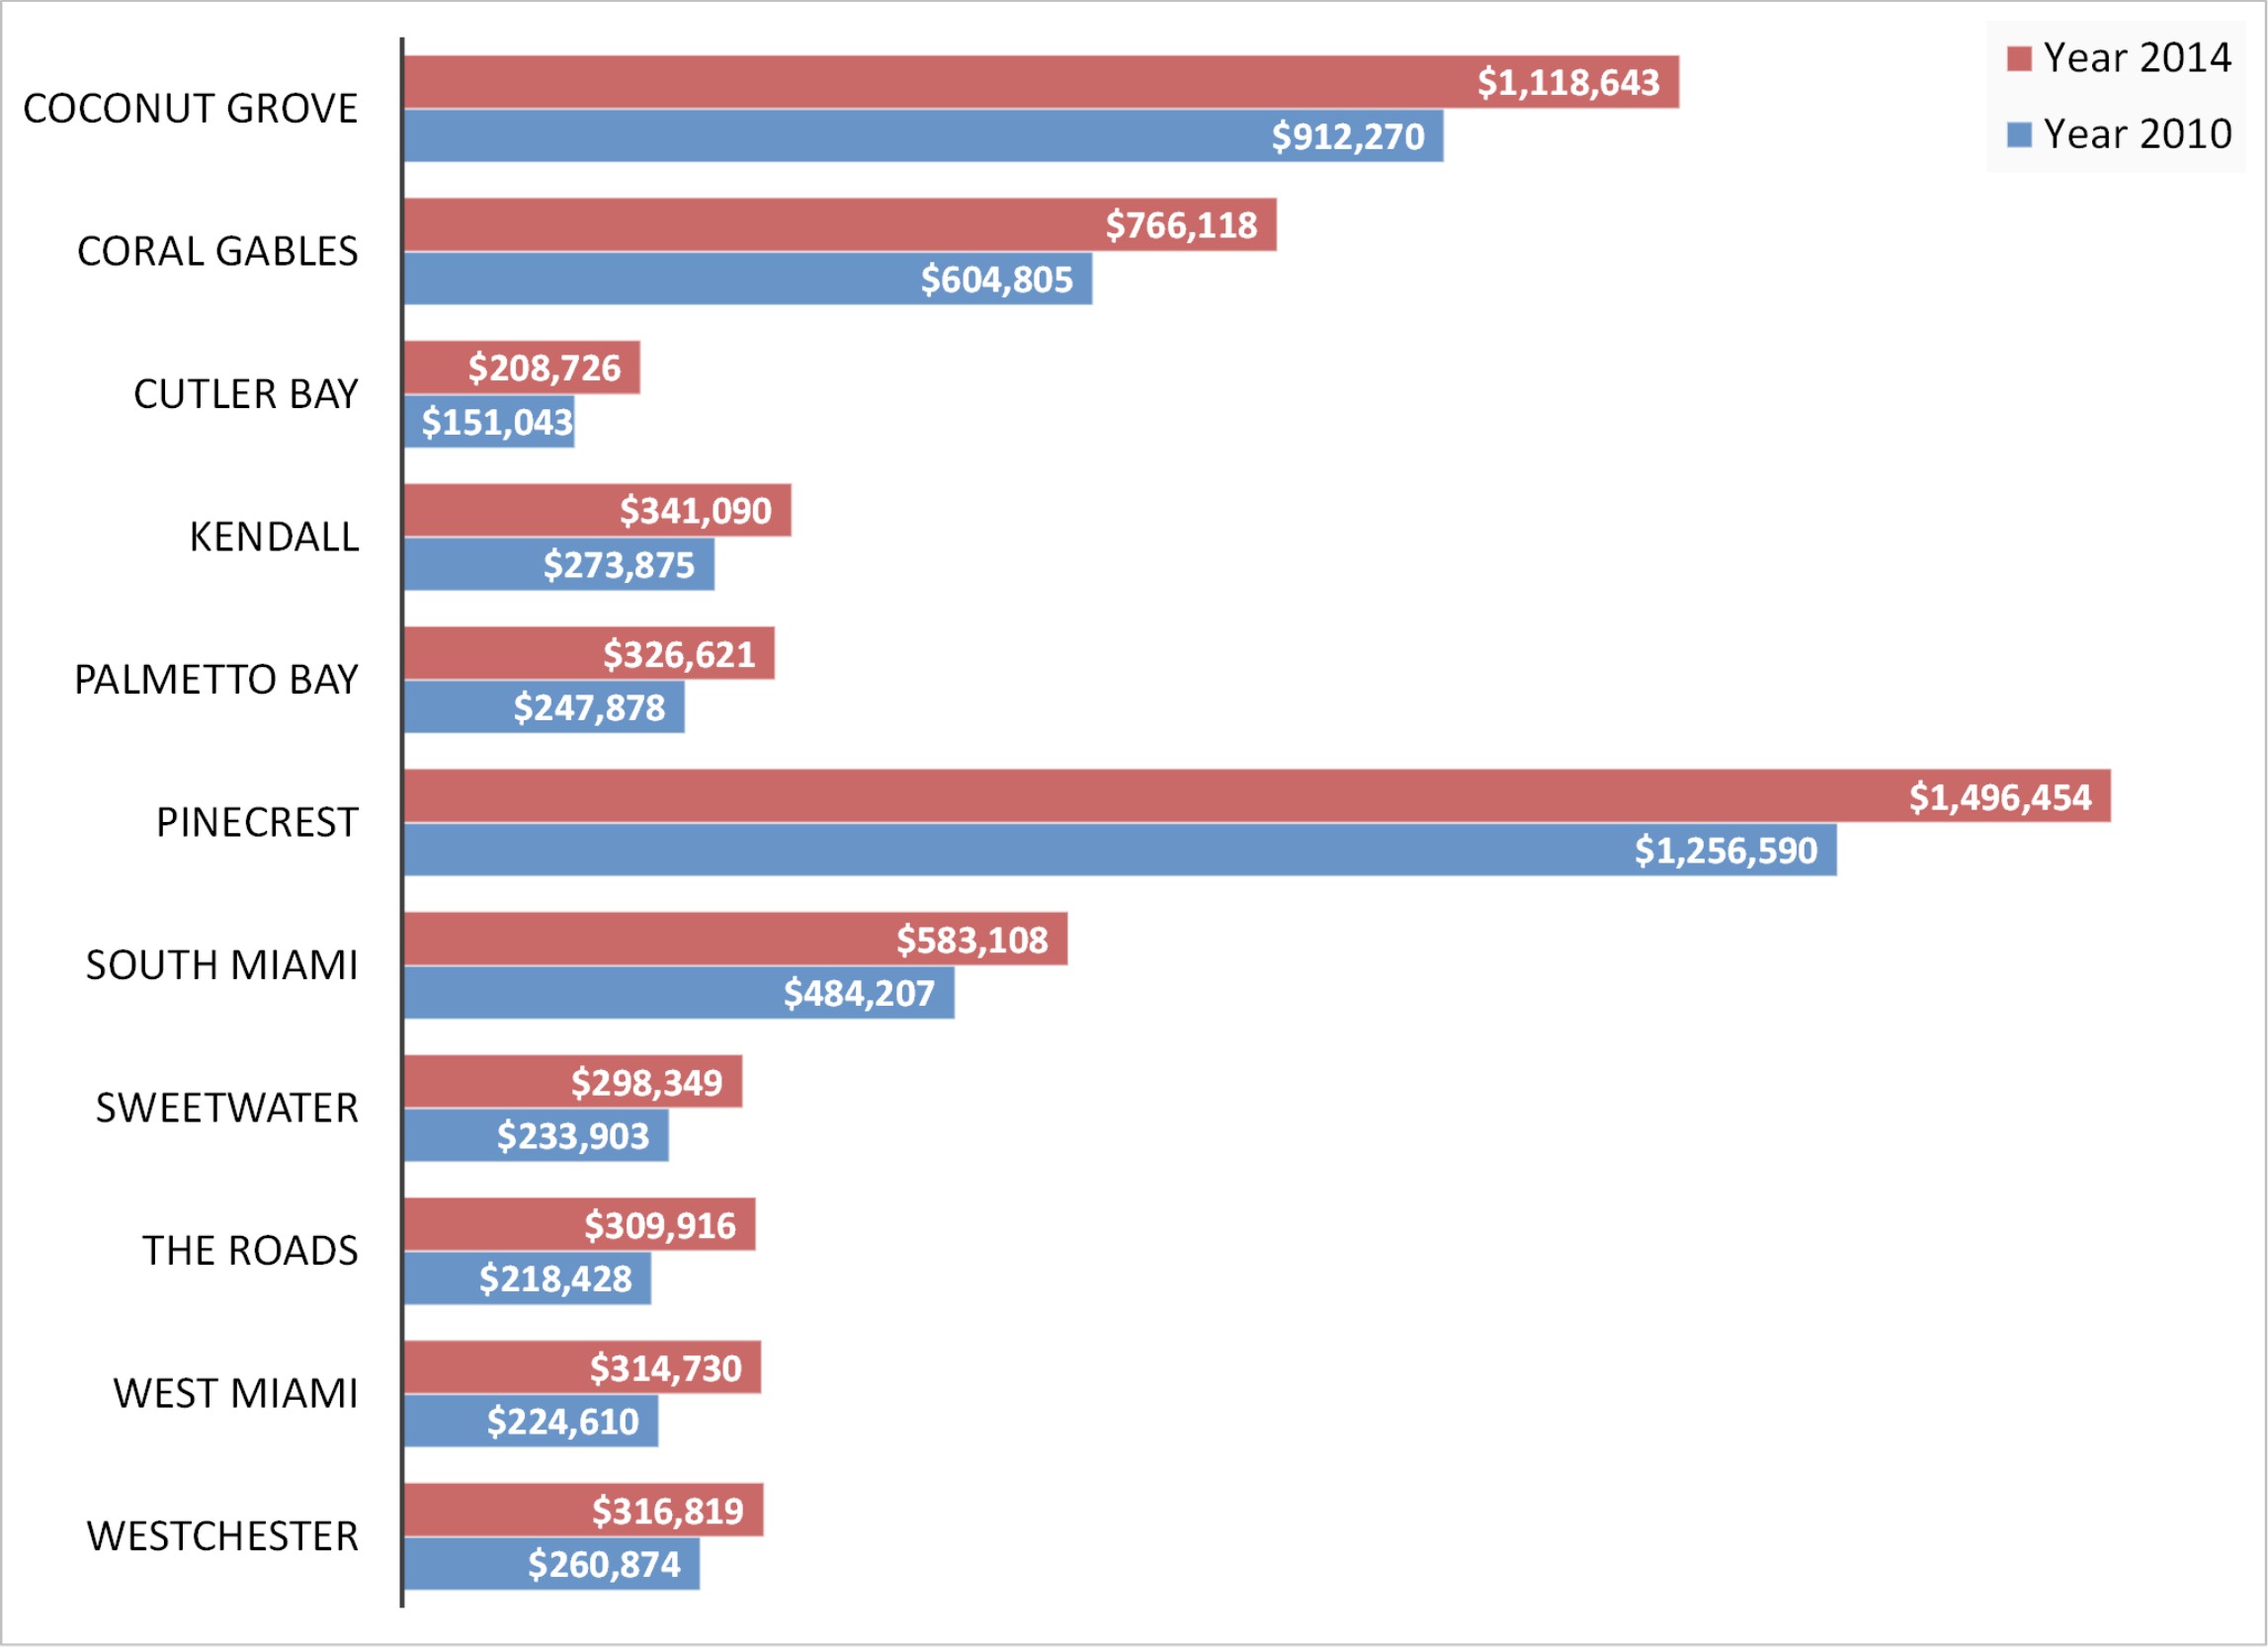
Average Home Price – Single Family: Year-to-date May 2010 vs Year-to-date May 2014
Below graph details the comparison between the average home price in 2010 versus 2014 by city. For example. Kendall’s average home price year-to-date May 2010 was 273,875. Such average price has risen to $341,090 year-to-date May 2014.
How’s the condo-townhouse market? Learn more.
Days On Market or DOM – Single Family: Year-to-date May 2014
The below chart shows the number of days a property stays in the market for sale until it is sold. For example. Kendall’s DOM year-to-date May 2014 is 121 days. In other words, on average…from the moment a home hits the market for sale until it is sold is approximately 121 days.

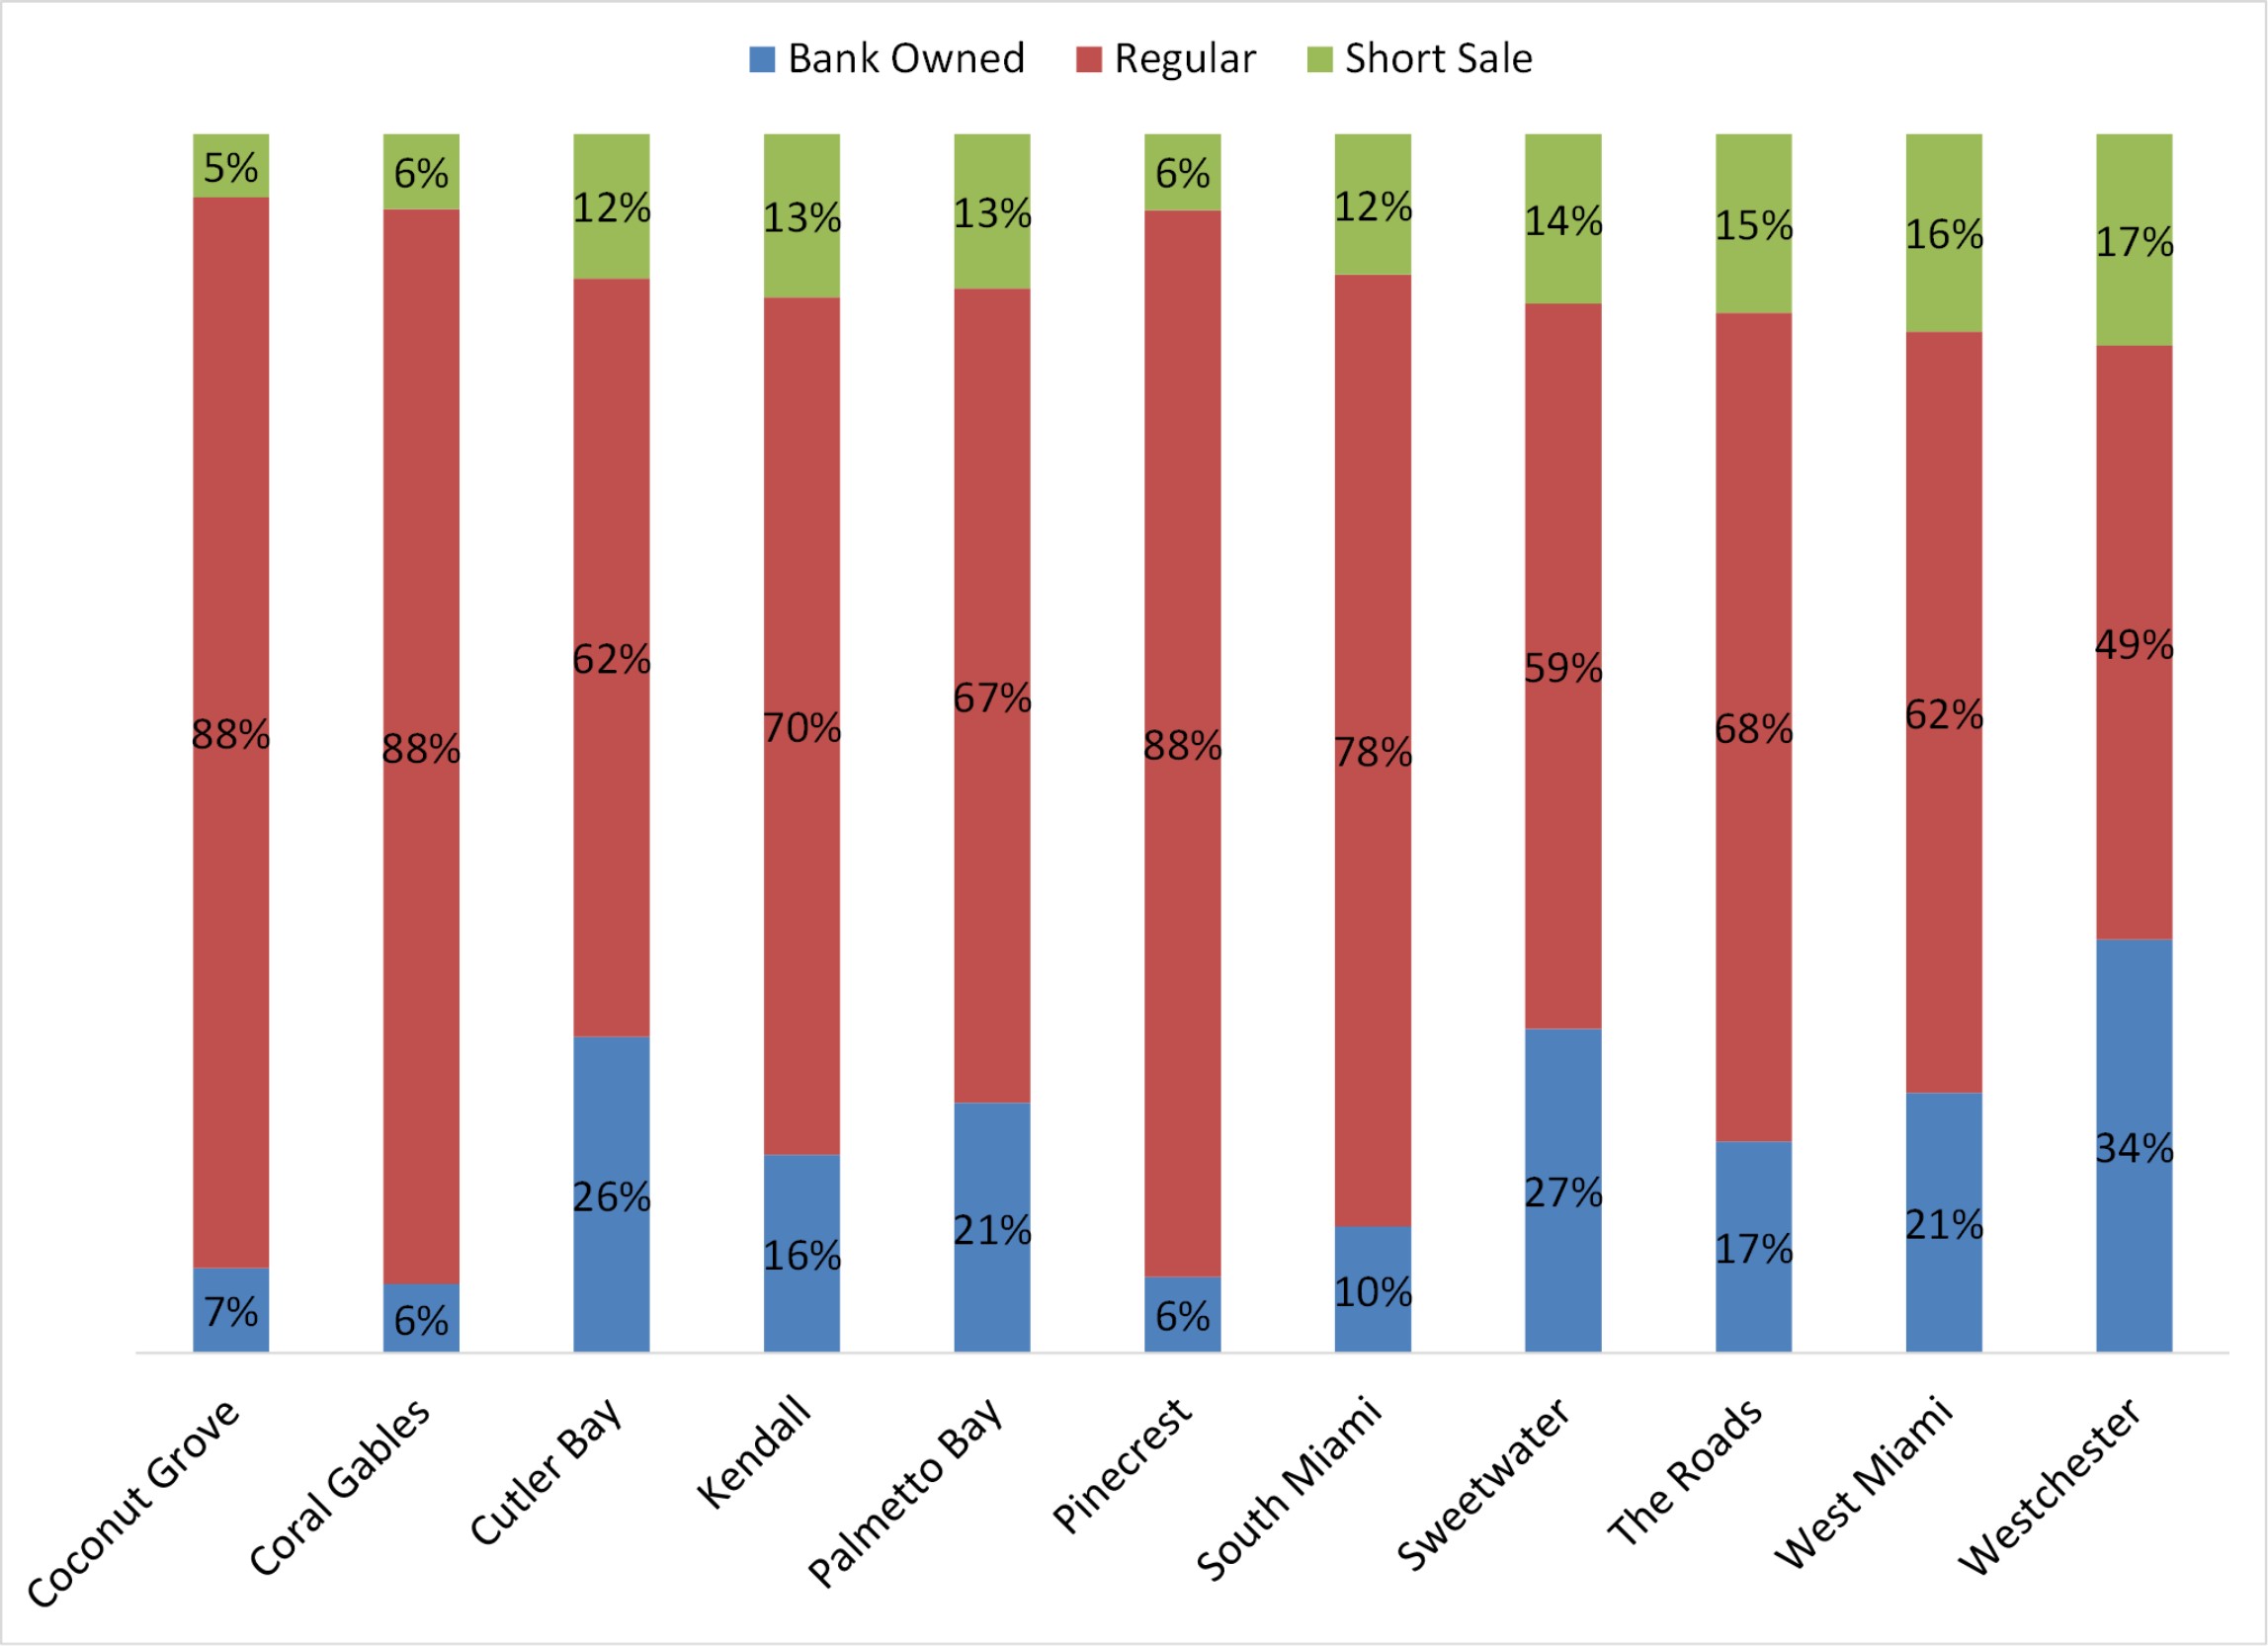
Transaction Type – Single Family: Year-to-date May 2014
The below graph details the type of sales taking place by city. For example. In Kendall…16% of all sold properties are bank owned. 70% are regular sales. And 13% of all sold homes are short sales.