Home Prices Spike. And There Are No Homes For Sale!

It’s a seller’s market throughout Miami as prices get hot during the first quarter of 2015. Quite a turn around from the later half of 2014.  Why the rebound? Foreclosures are no where to be seen and equity sellers (regular home owners like you and I) are gripping to their homes with vengeance reclaiming what they had lost in value since the real estate crisis.

This lack of inventory is giving buyers little to choose from and even lesser price negotiation leverage.  Sellers are literally getting away with murder by asking what they want for their home, and getting it.

Average Sold Price Miami Florida 2015

What’s the outlook? If you ask a seller, bright. If you’re asking a buyer, it sucks. The foreclosure market is expected to continue to dwindle.  The economy is expected to continue to improve.  And as long as home price appreciation meets or exceeds  the cost for home owners to hold onto their properties, the expectation is that they’ll wait “a bit longer” to sell.

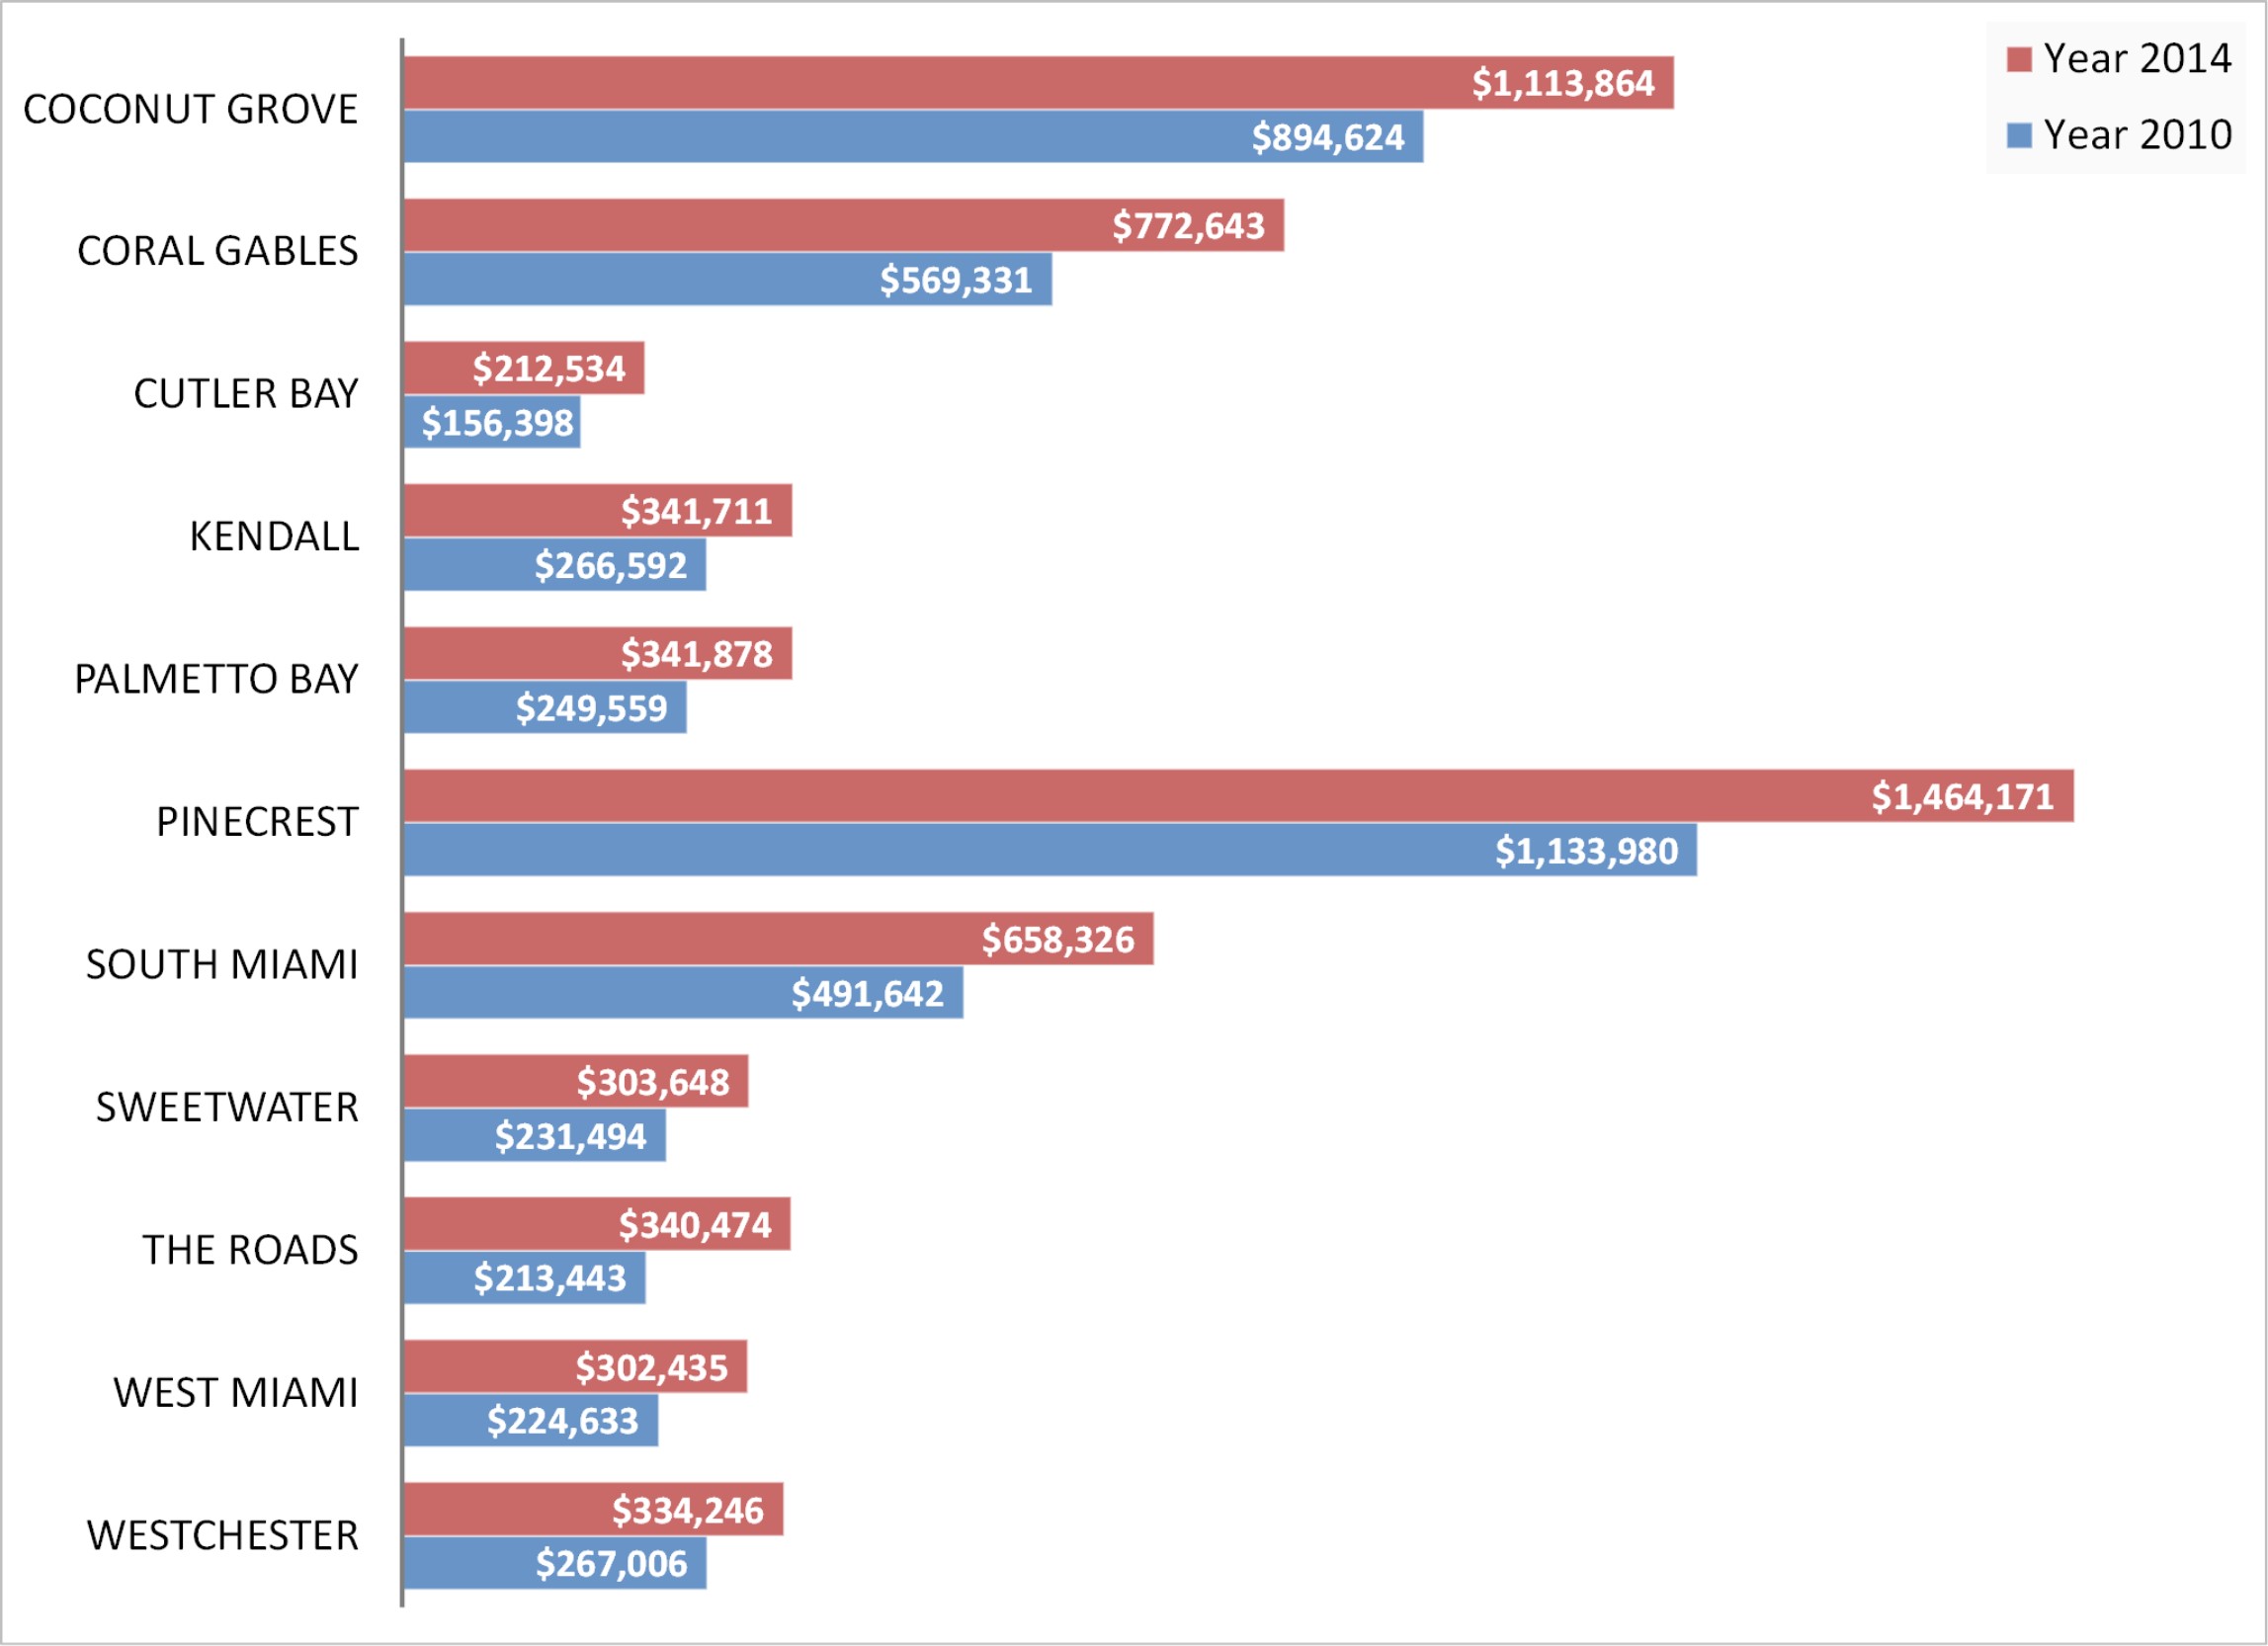
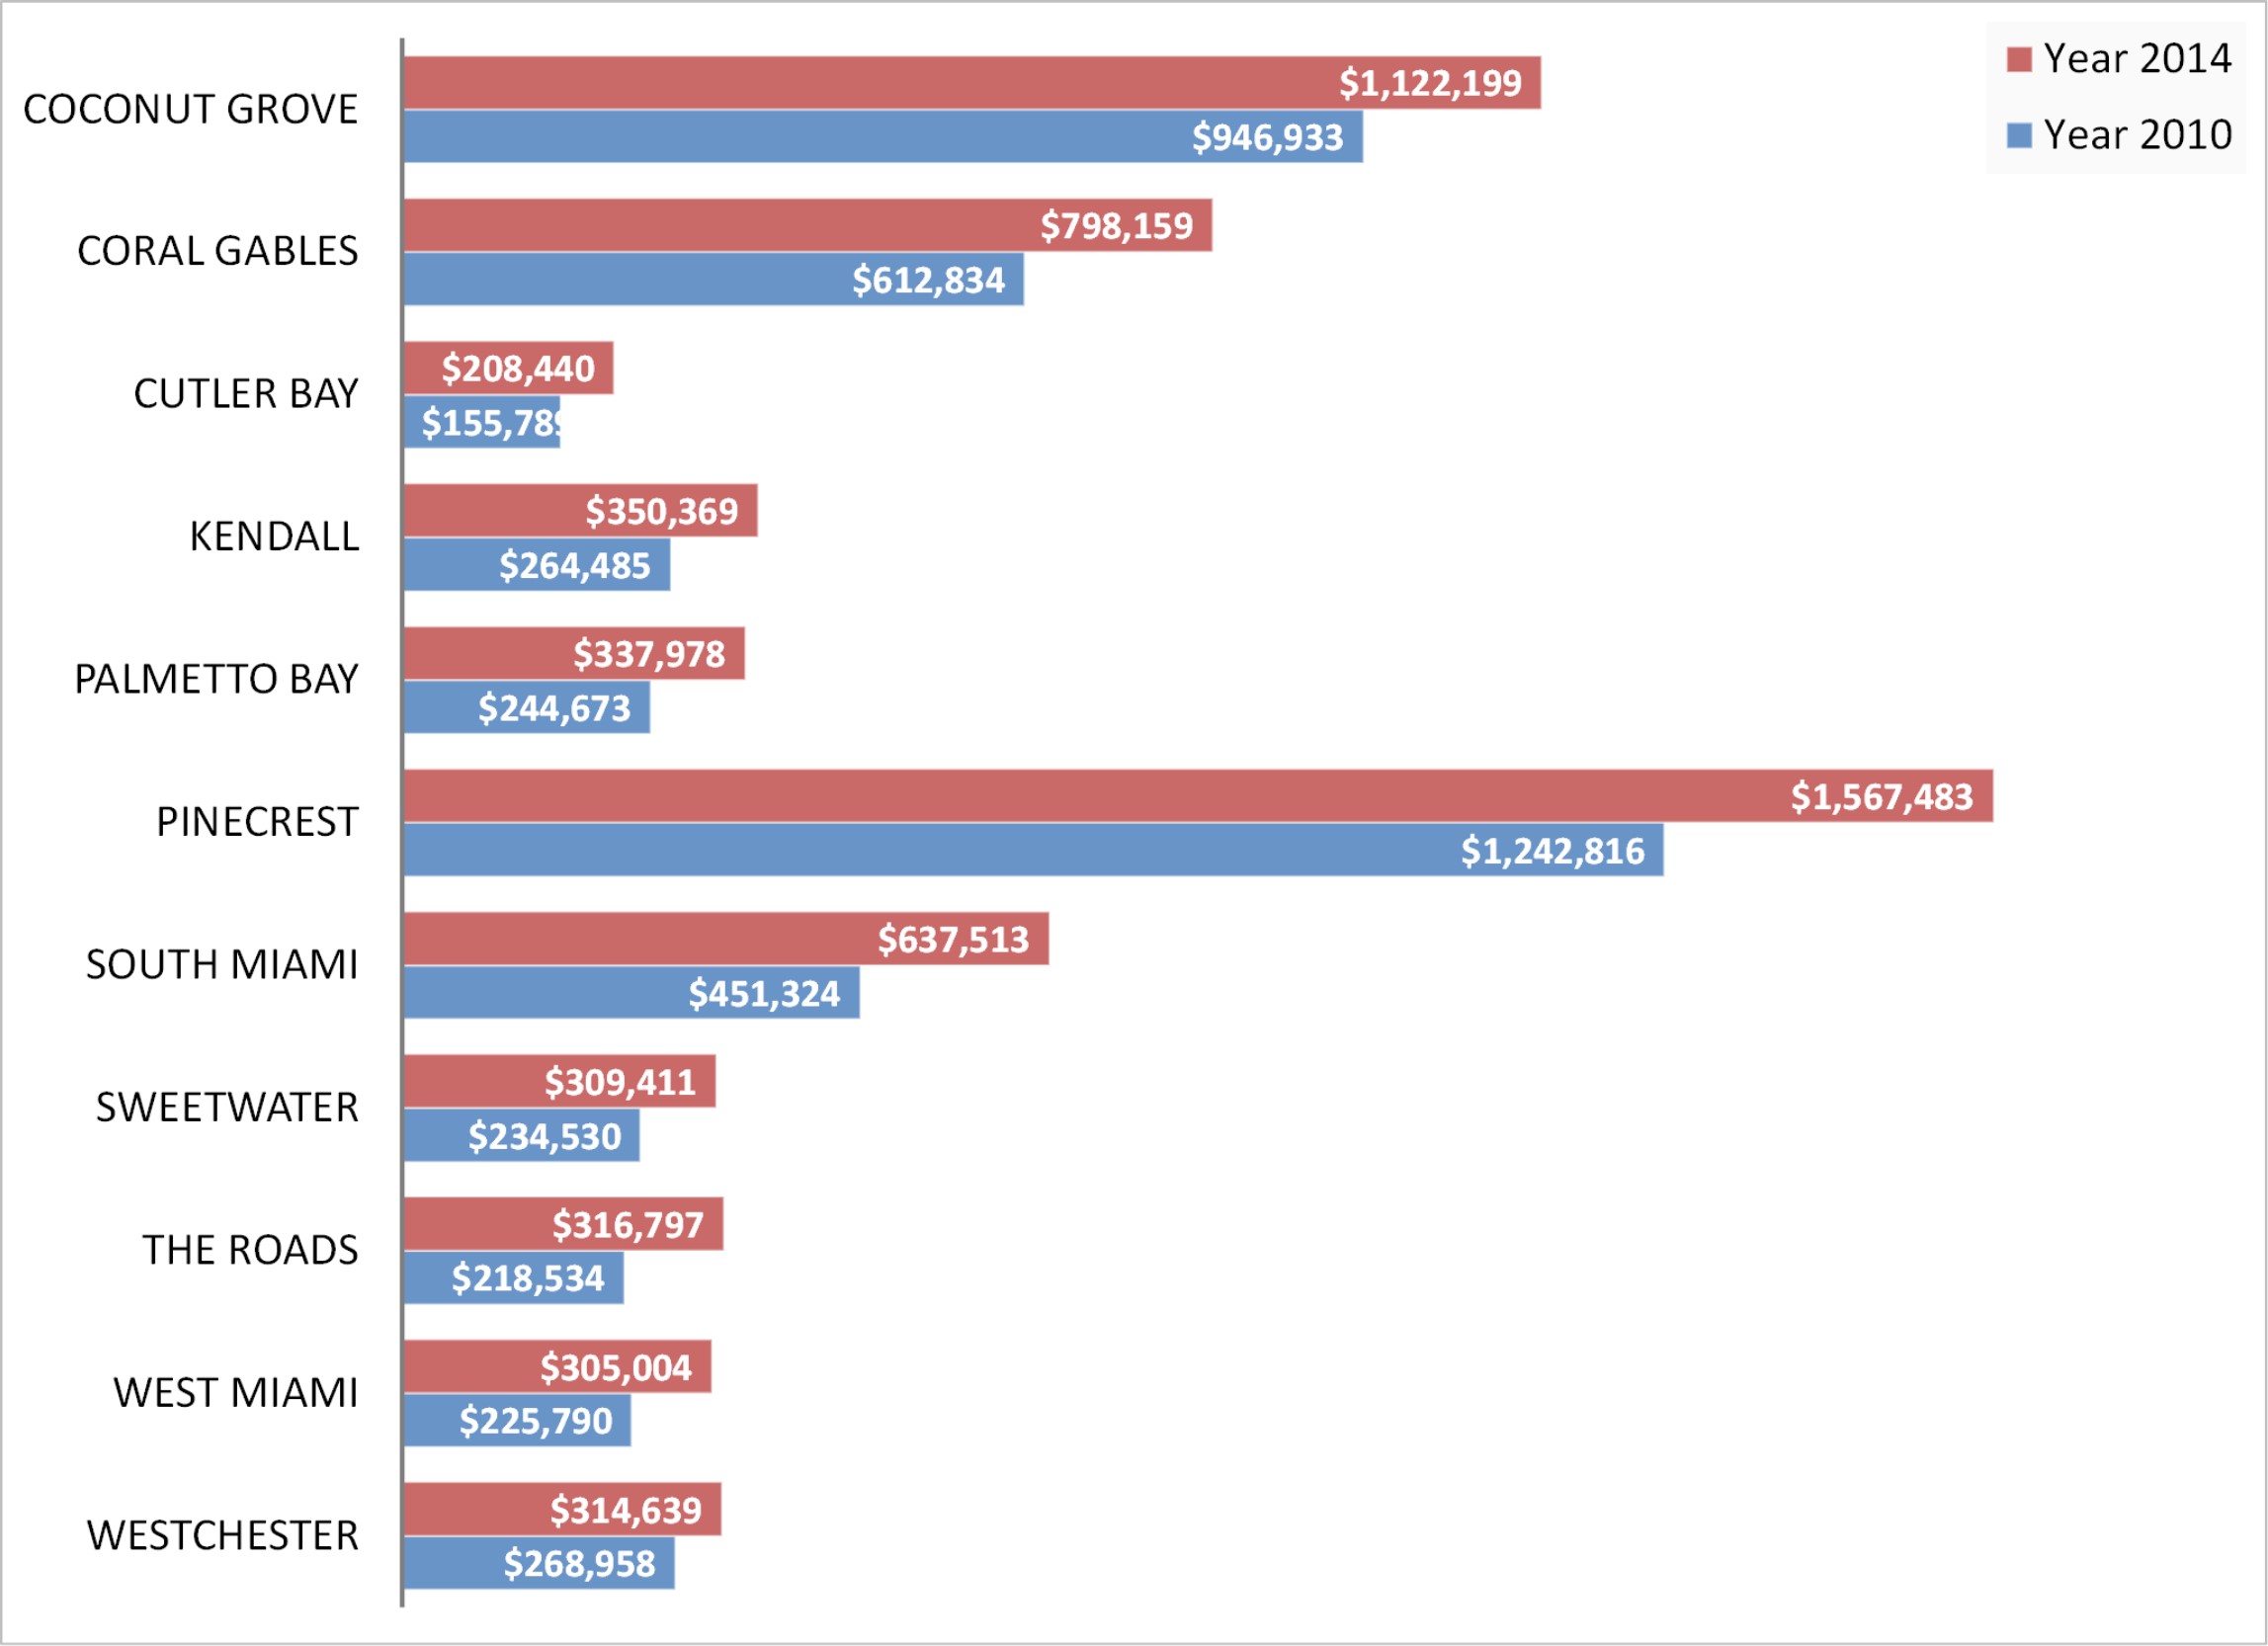
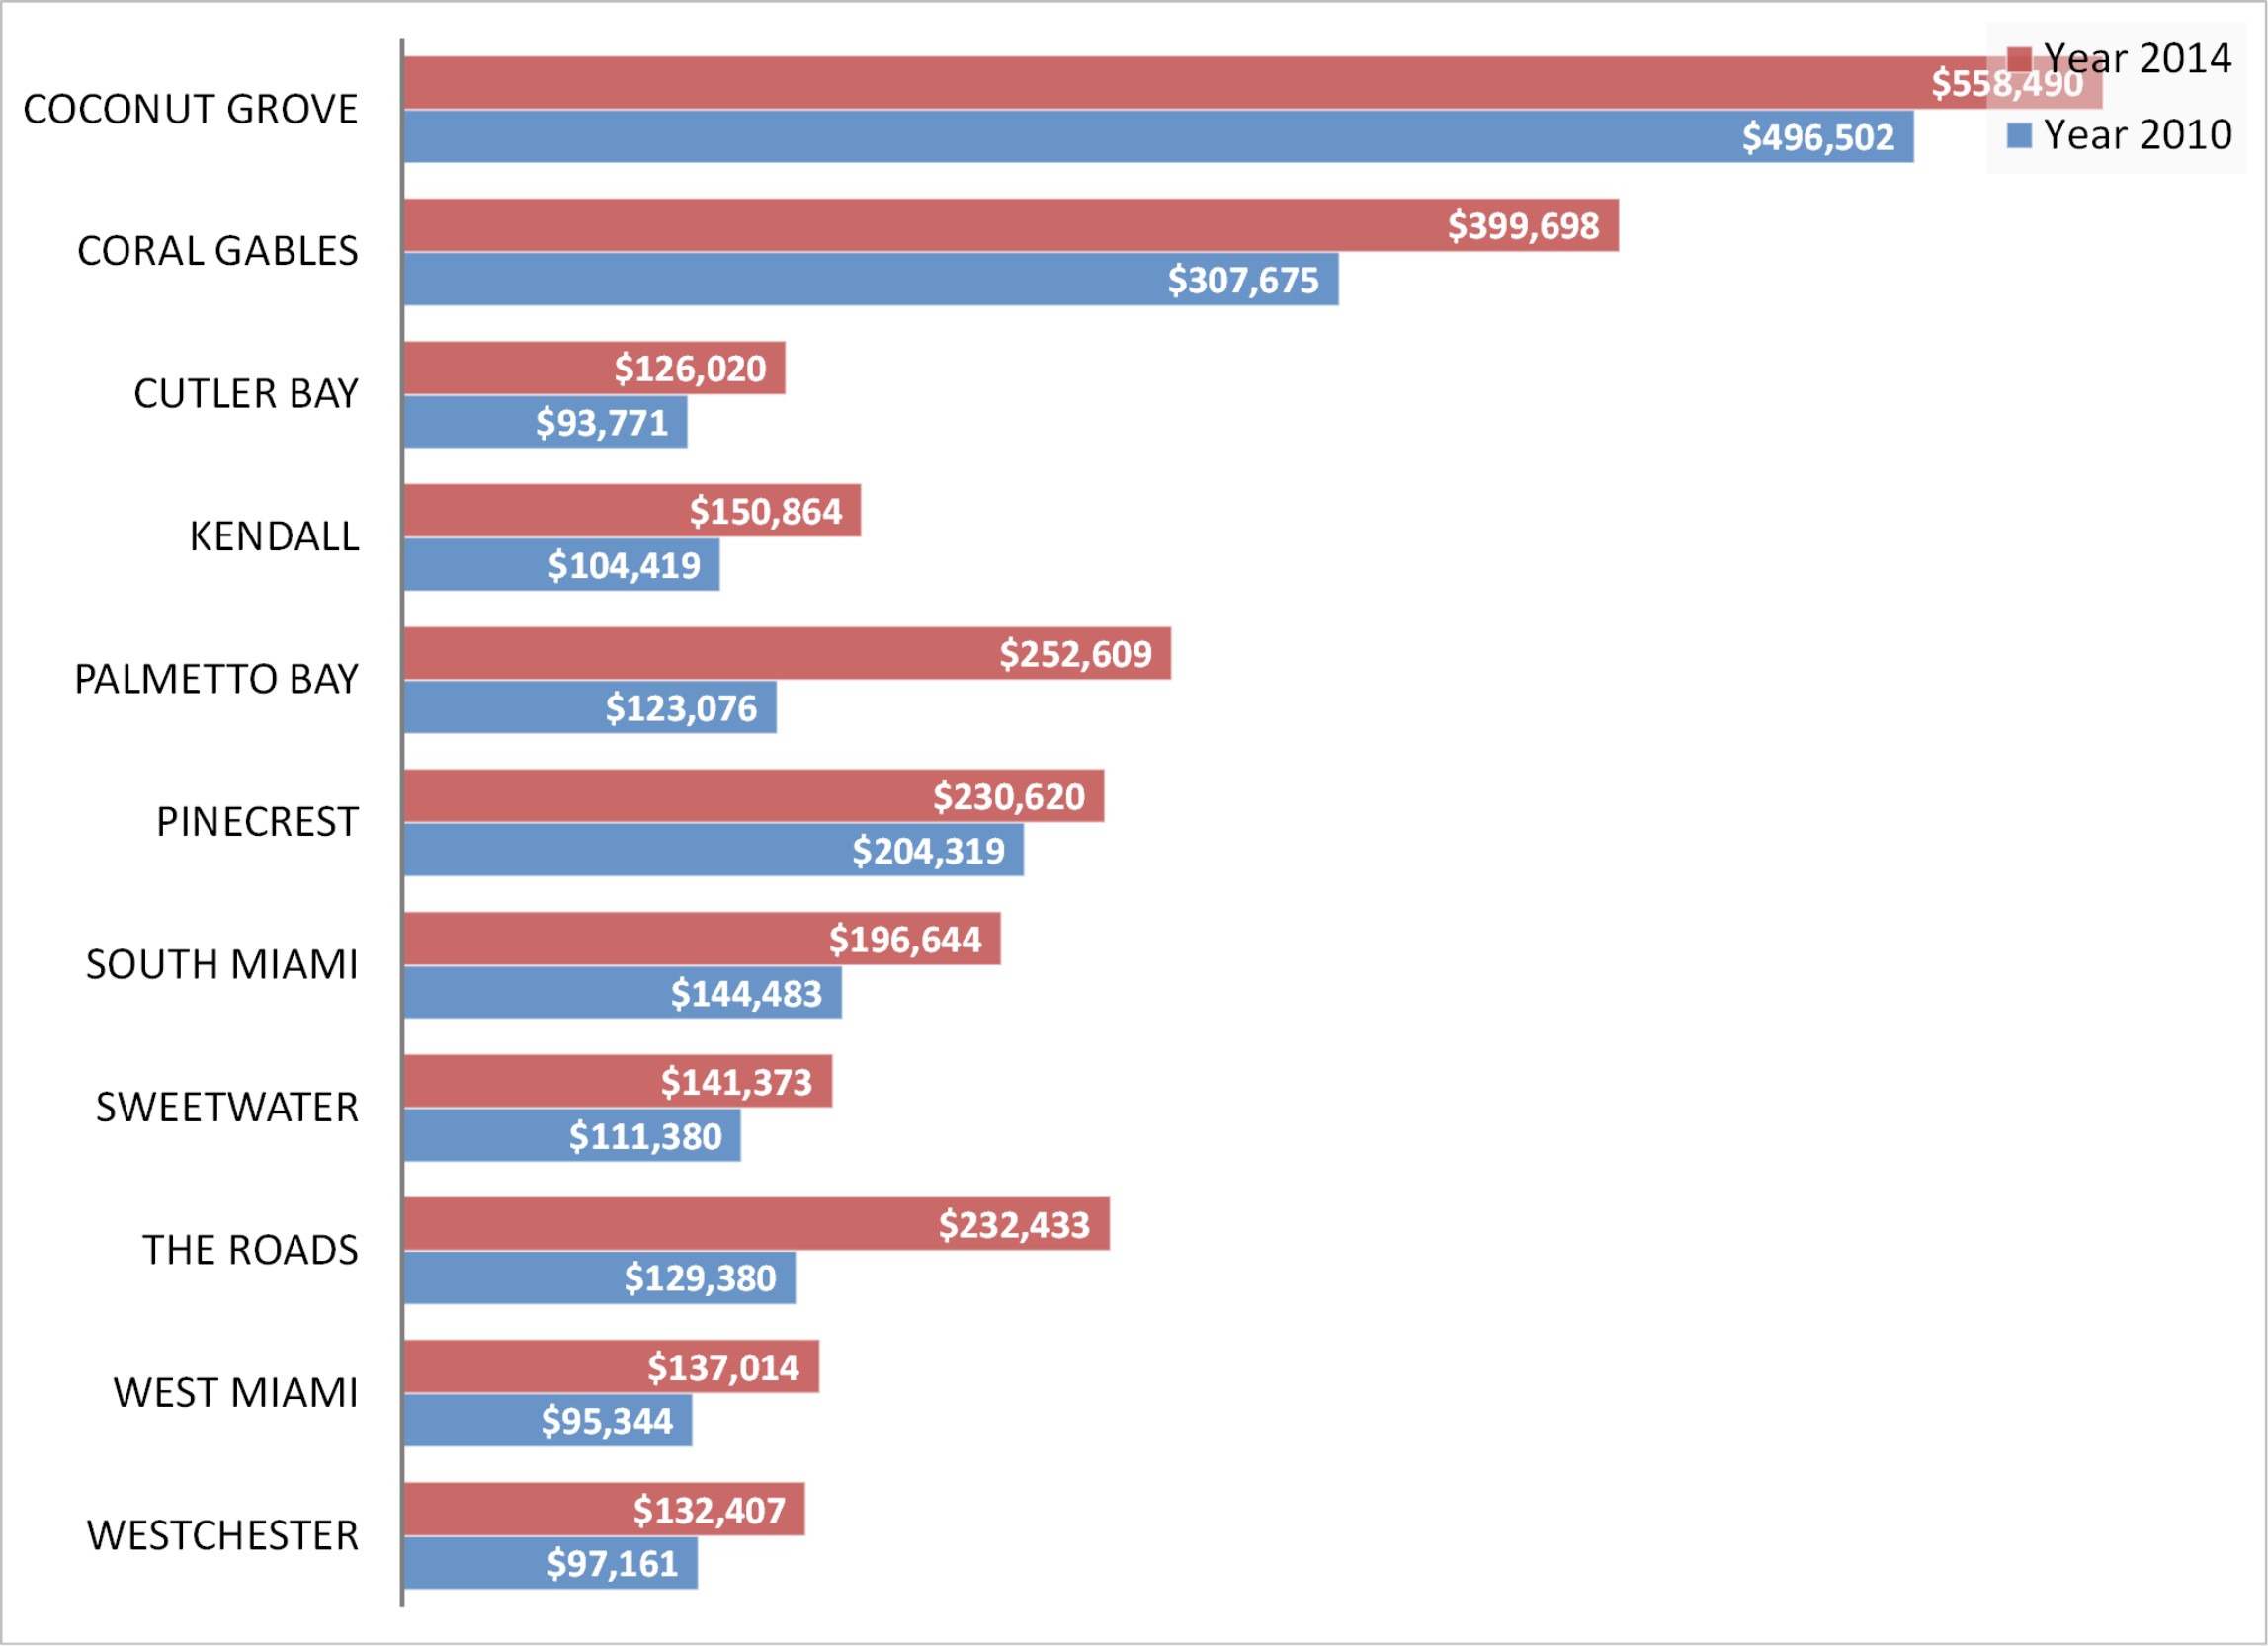
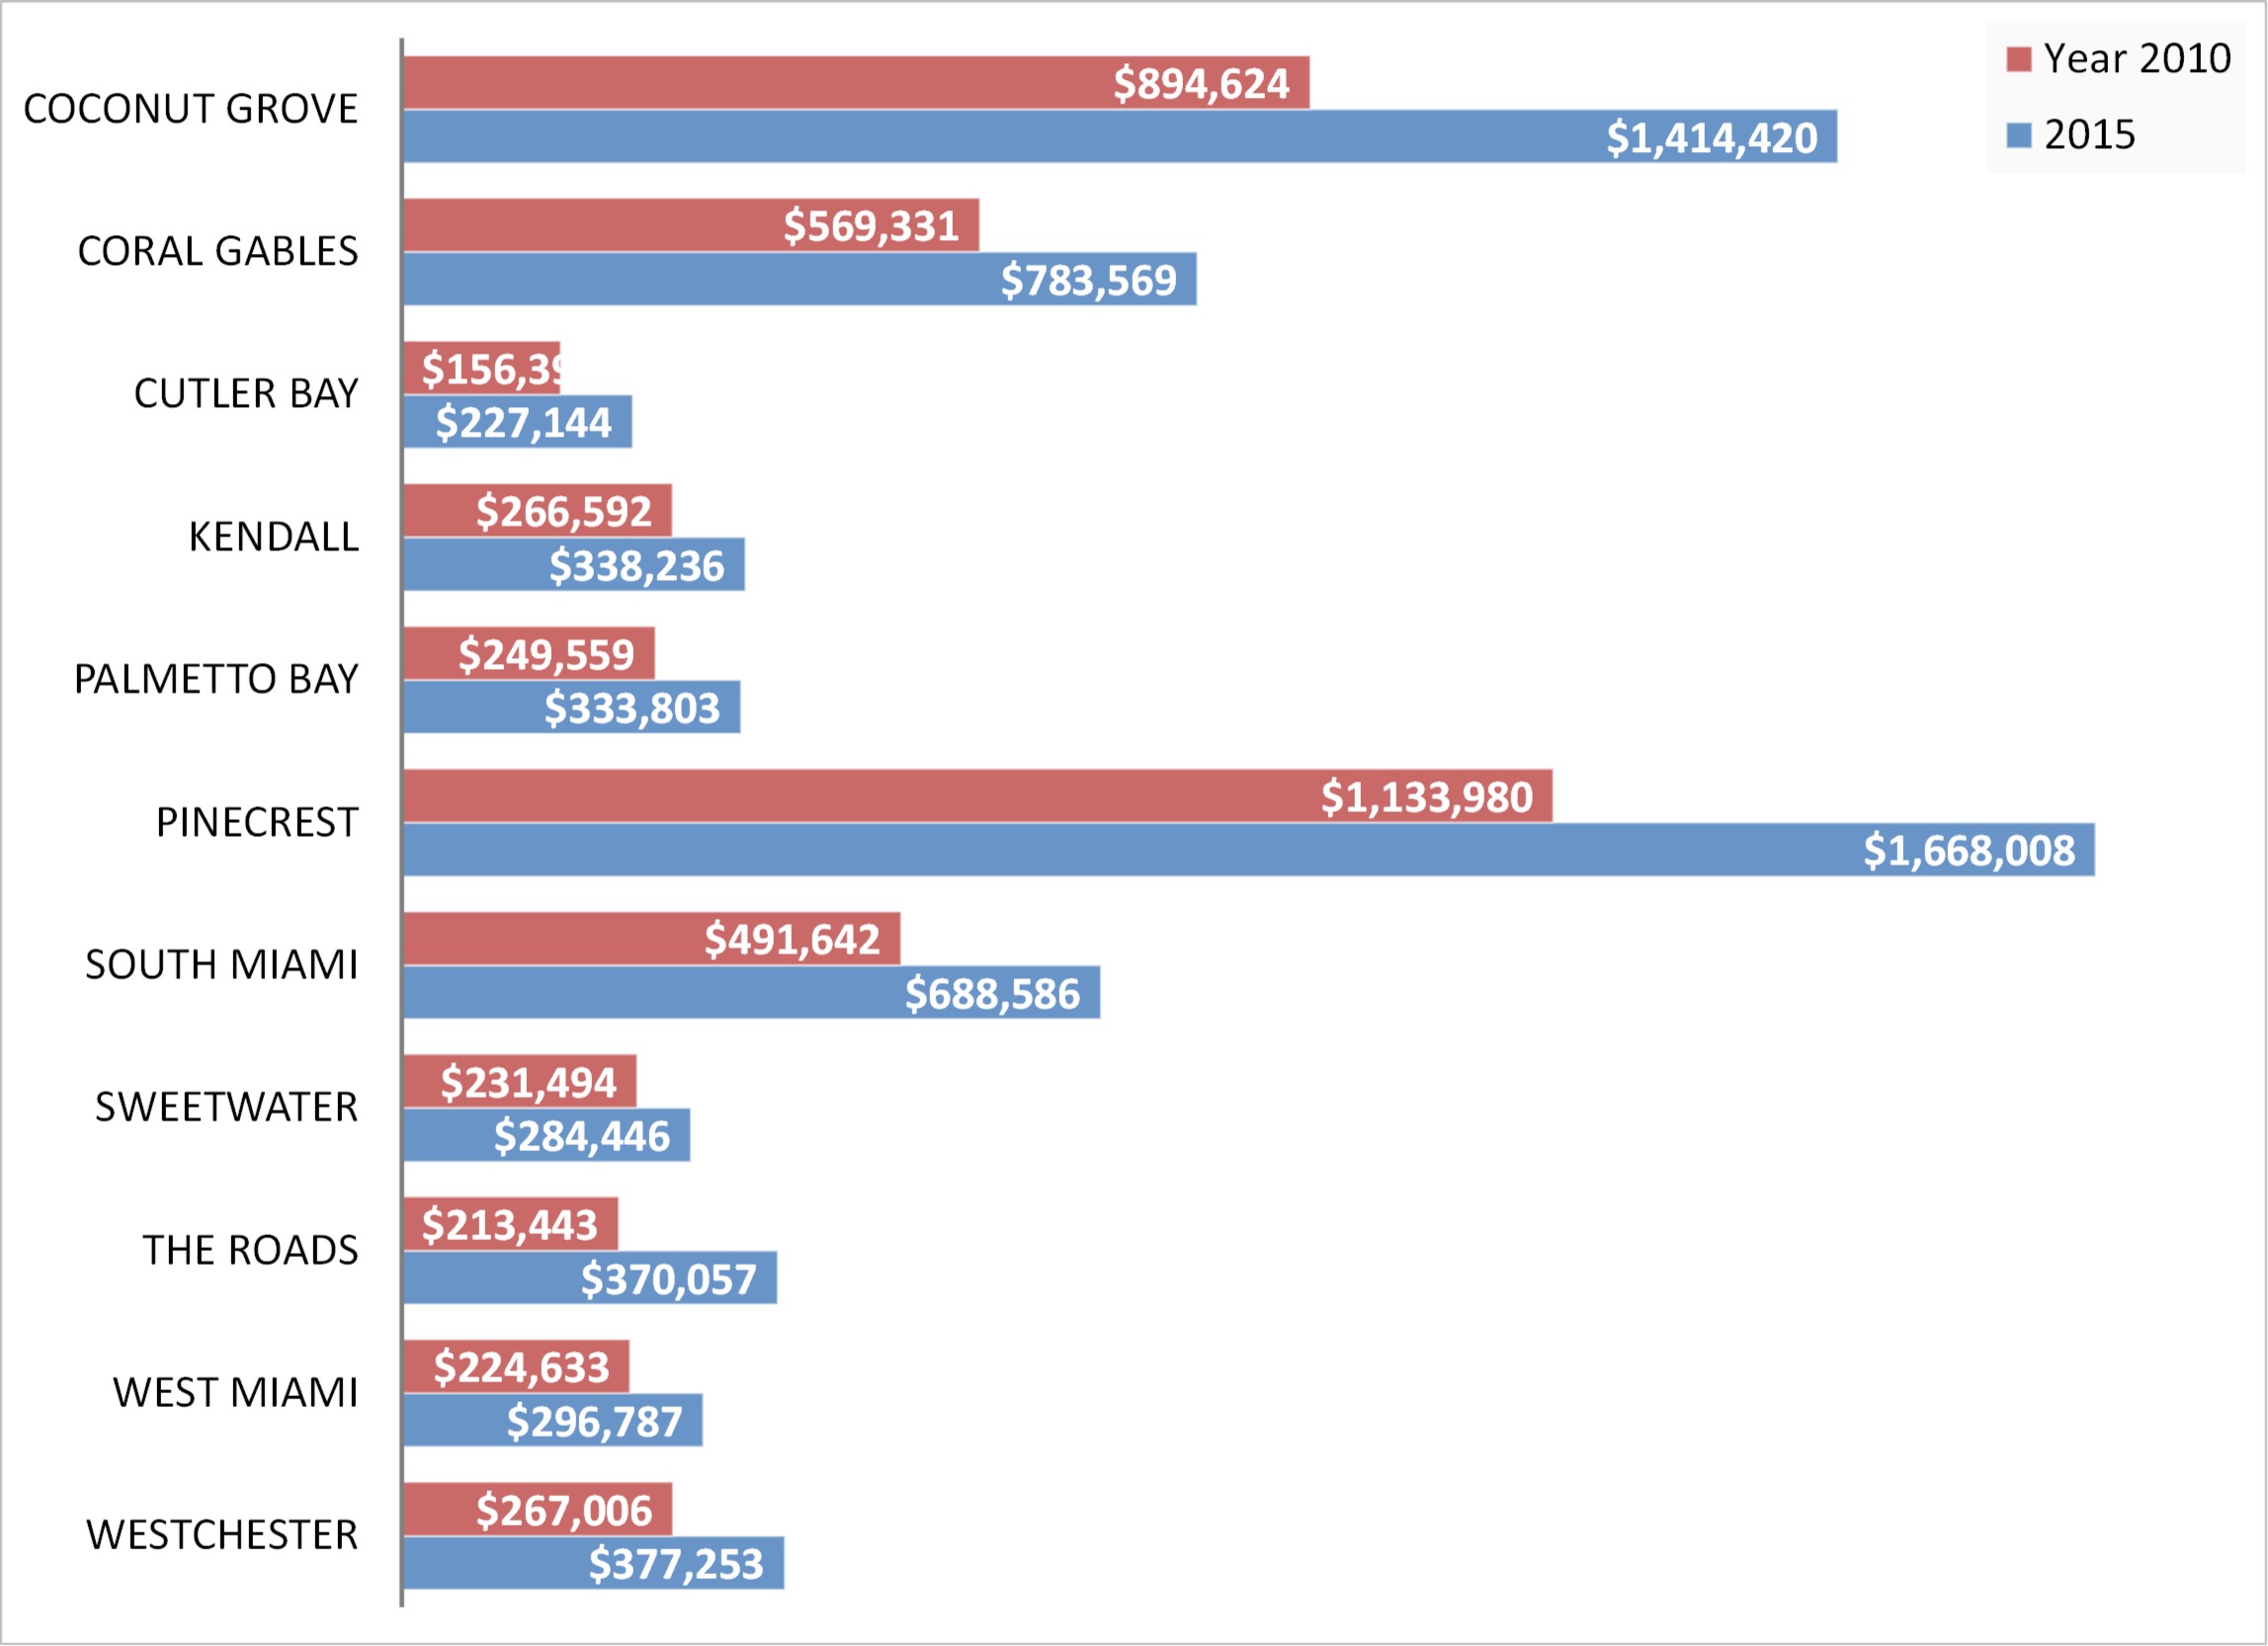
What was the average home worth in 2010 vs now is 2015? See below graph.

average single family price miami

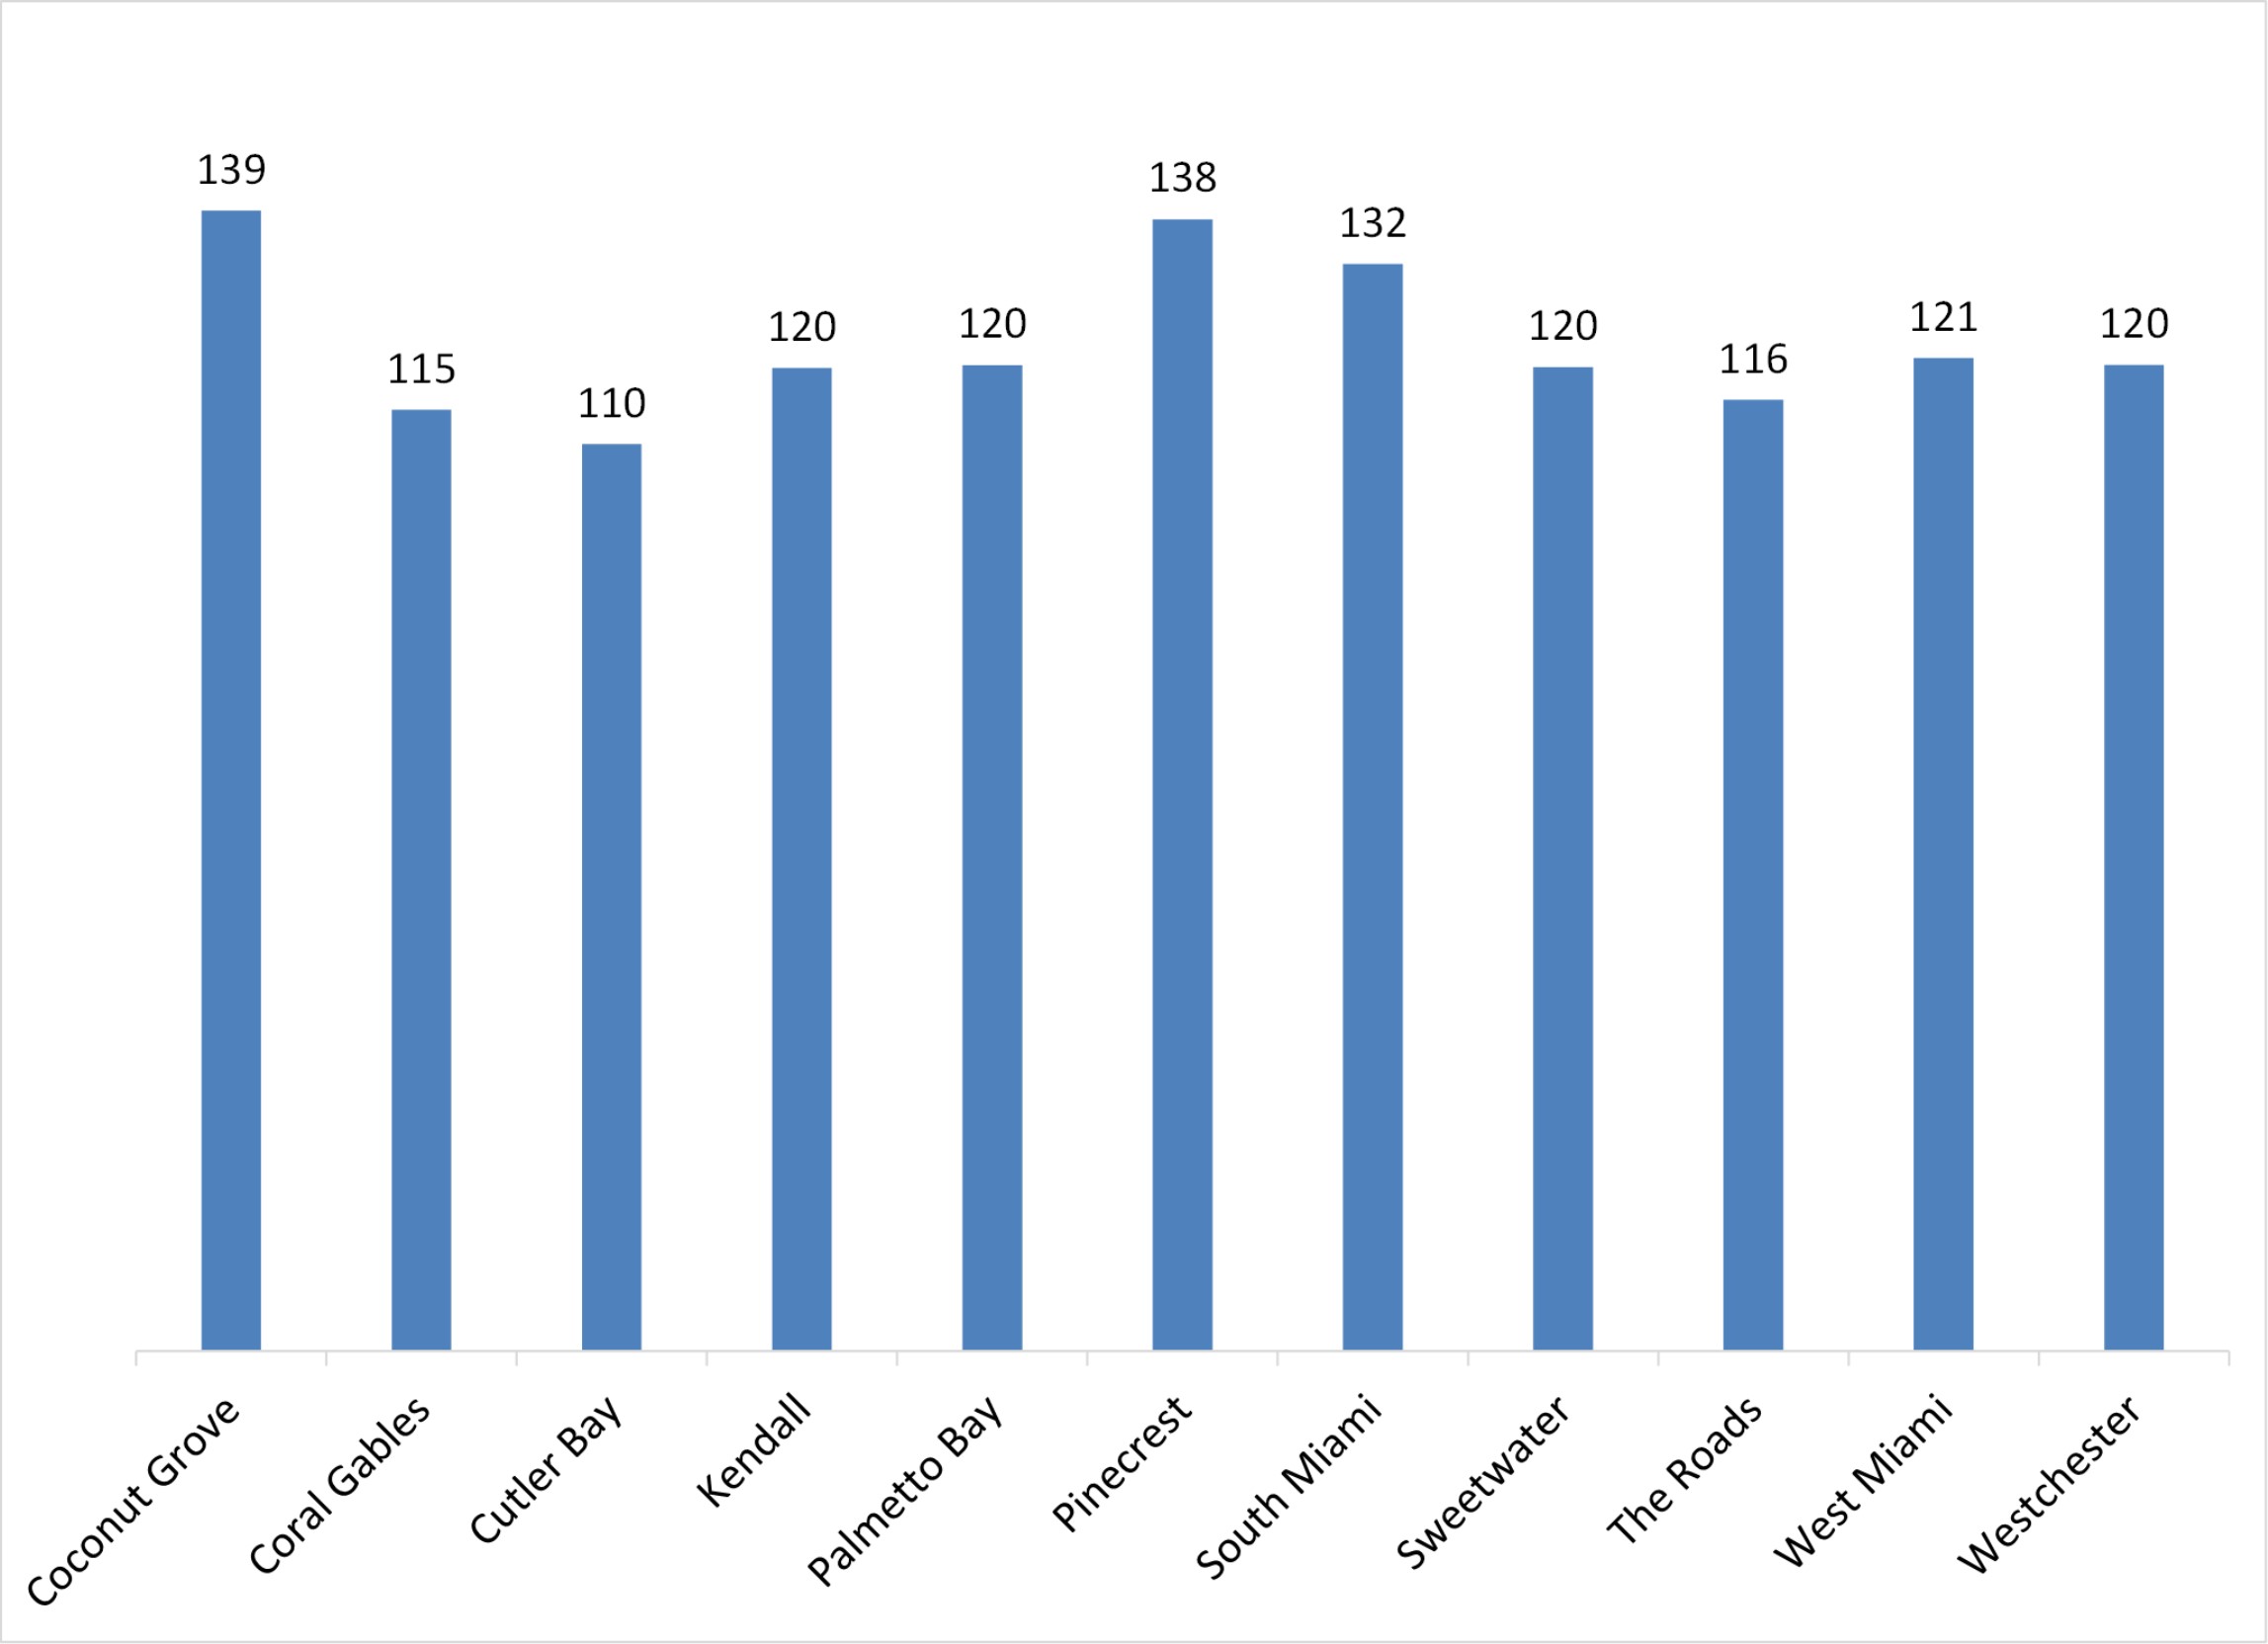
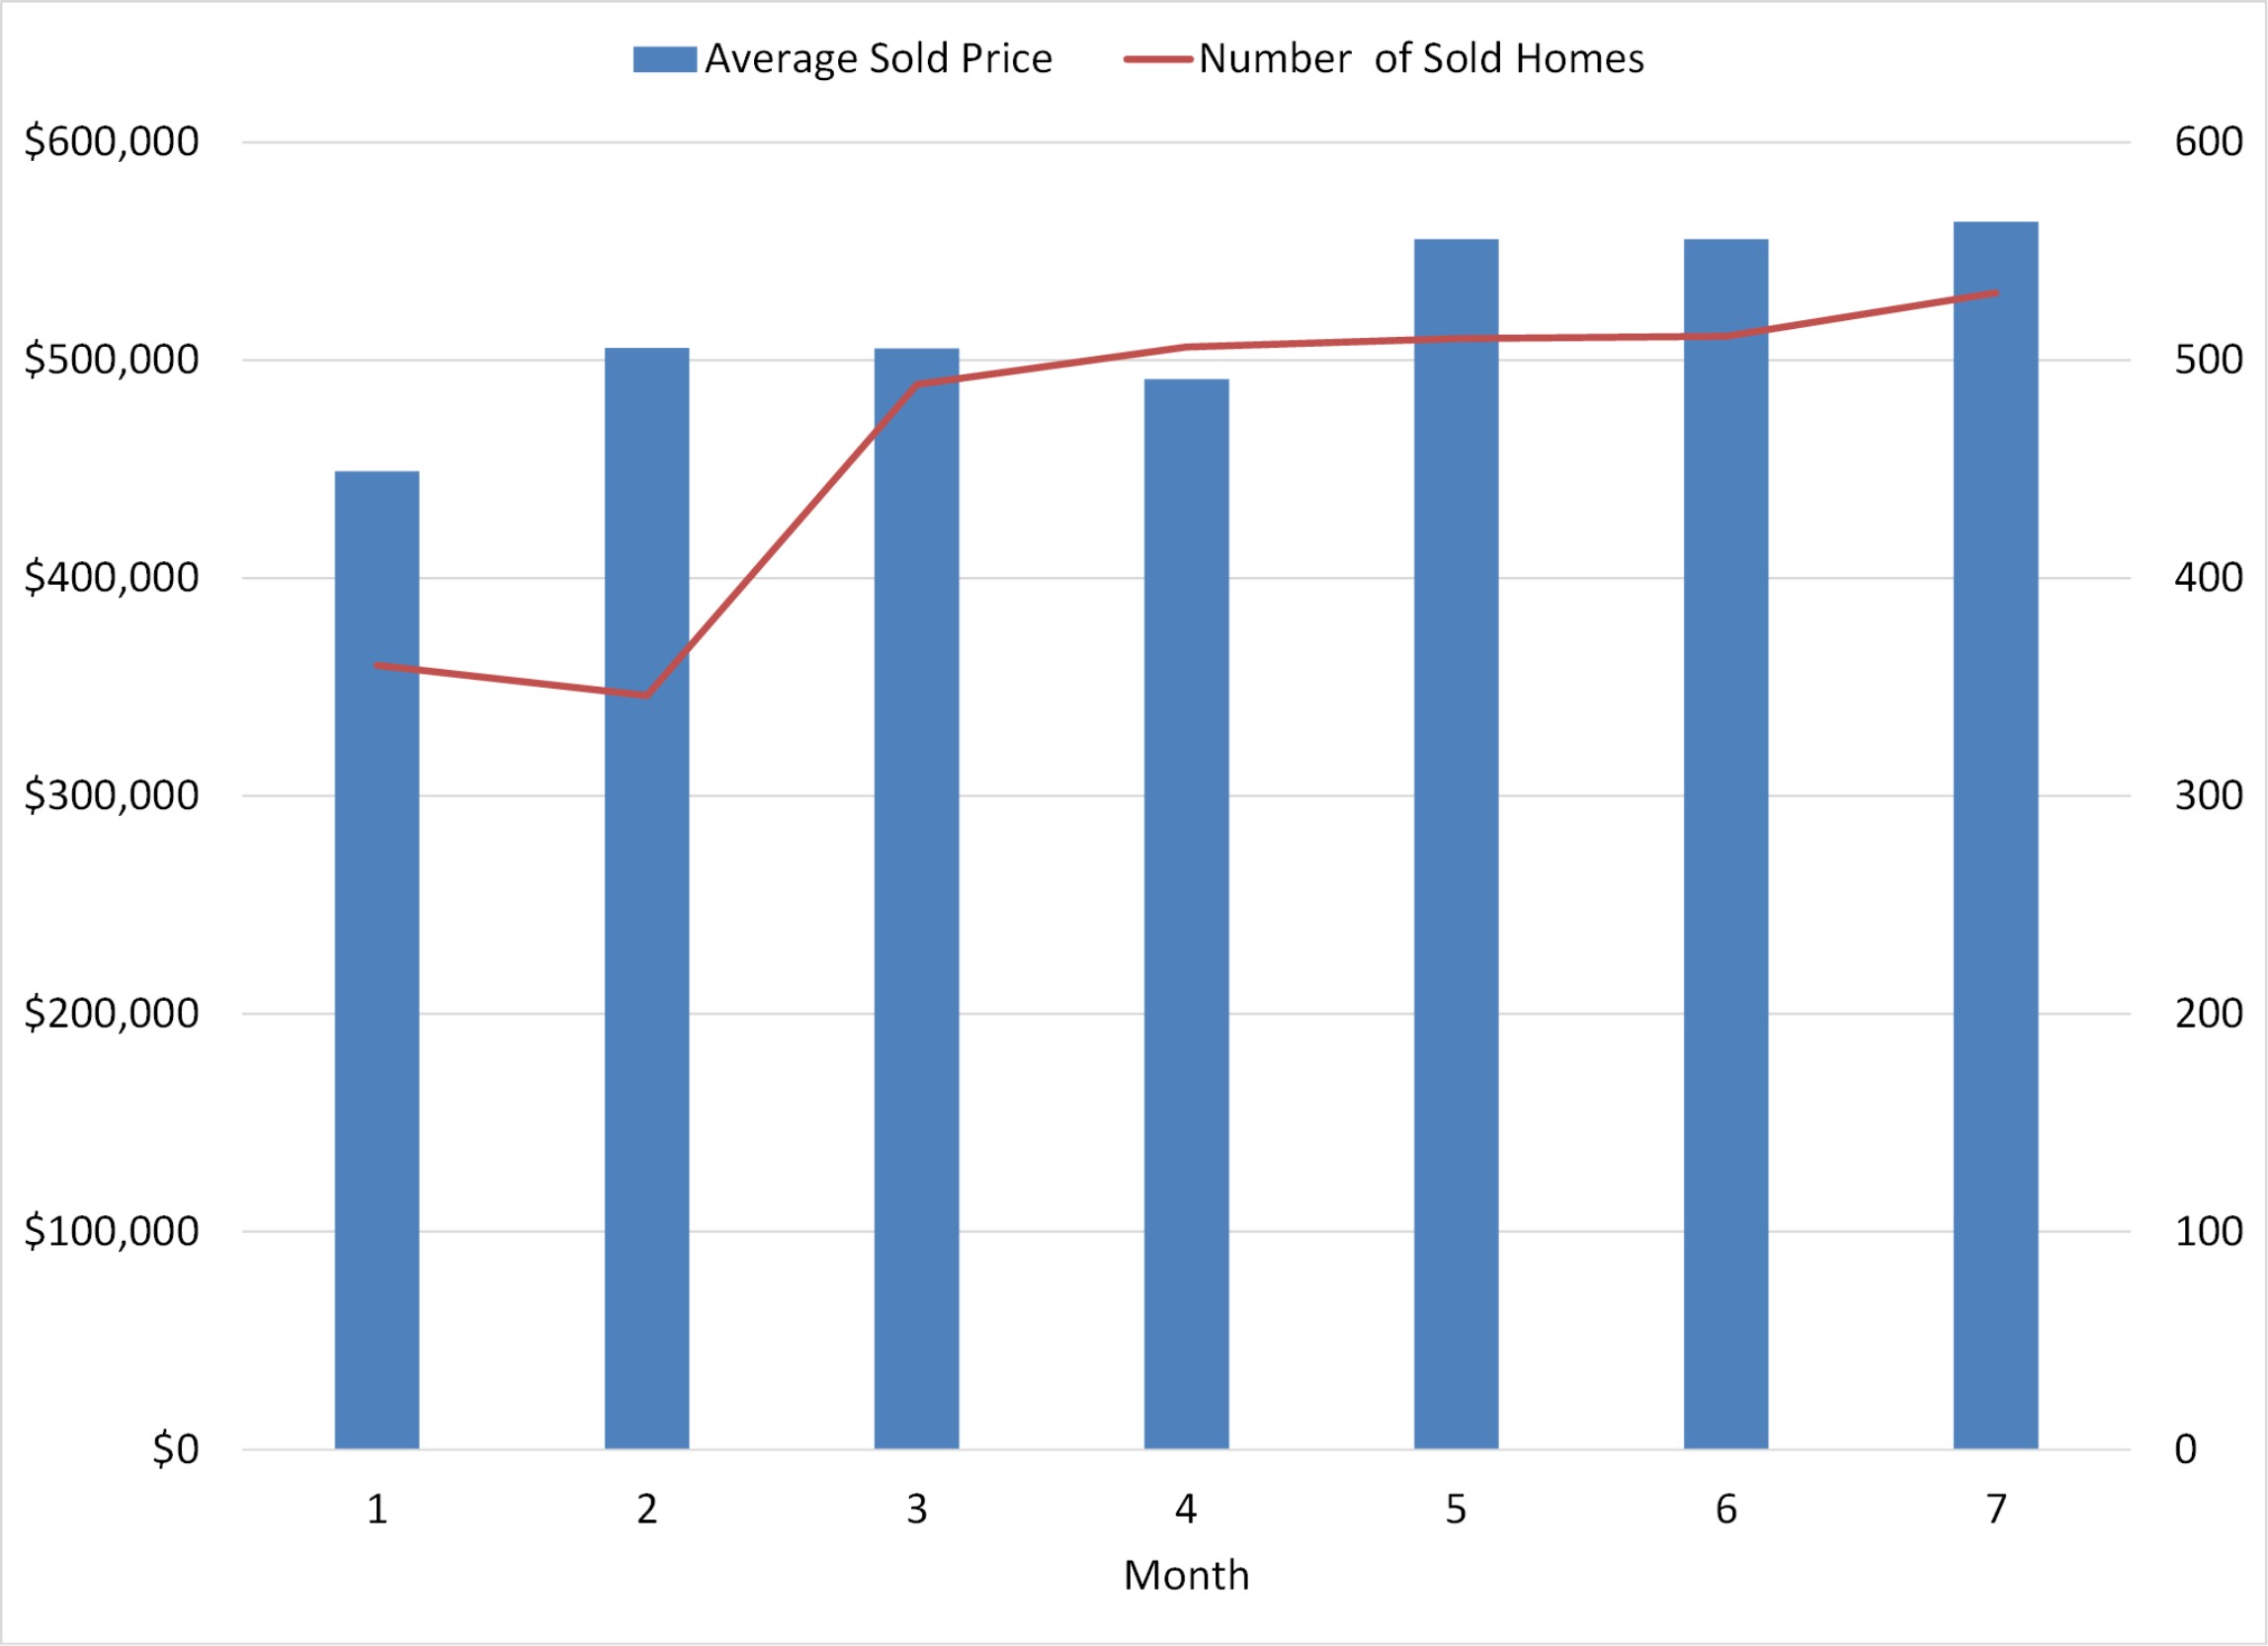
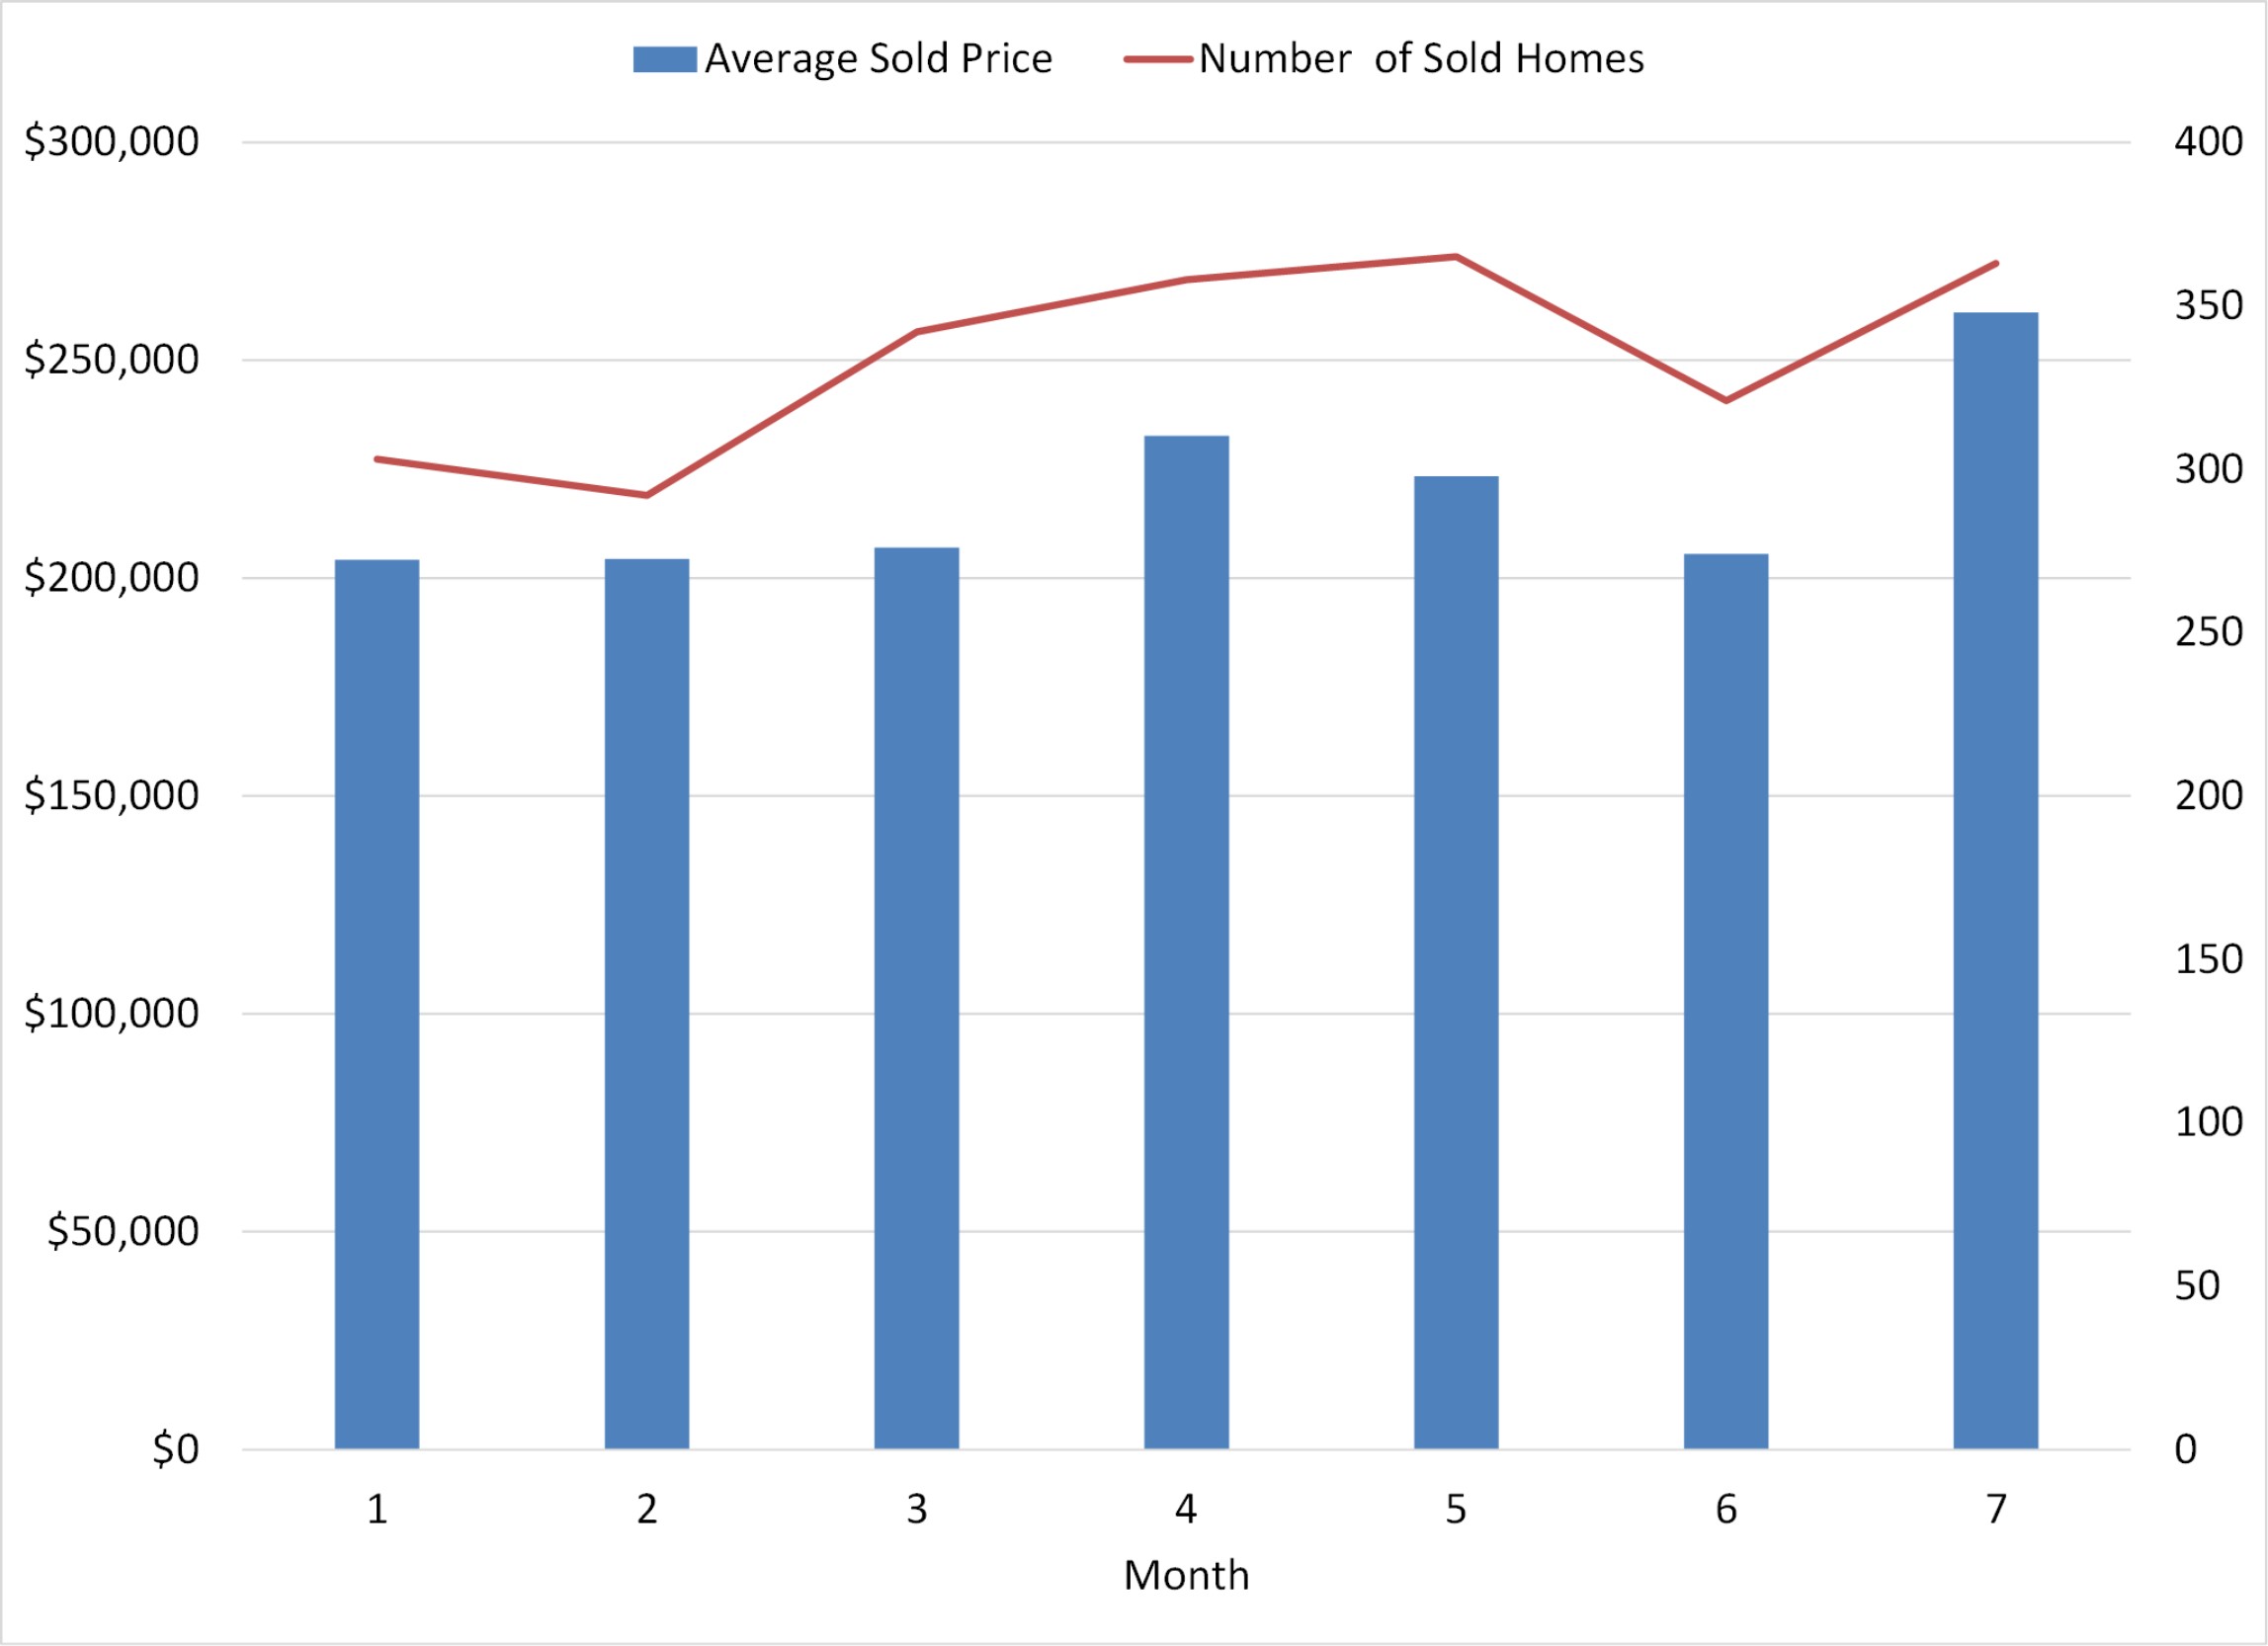
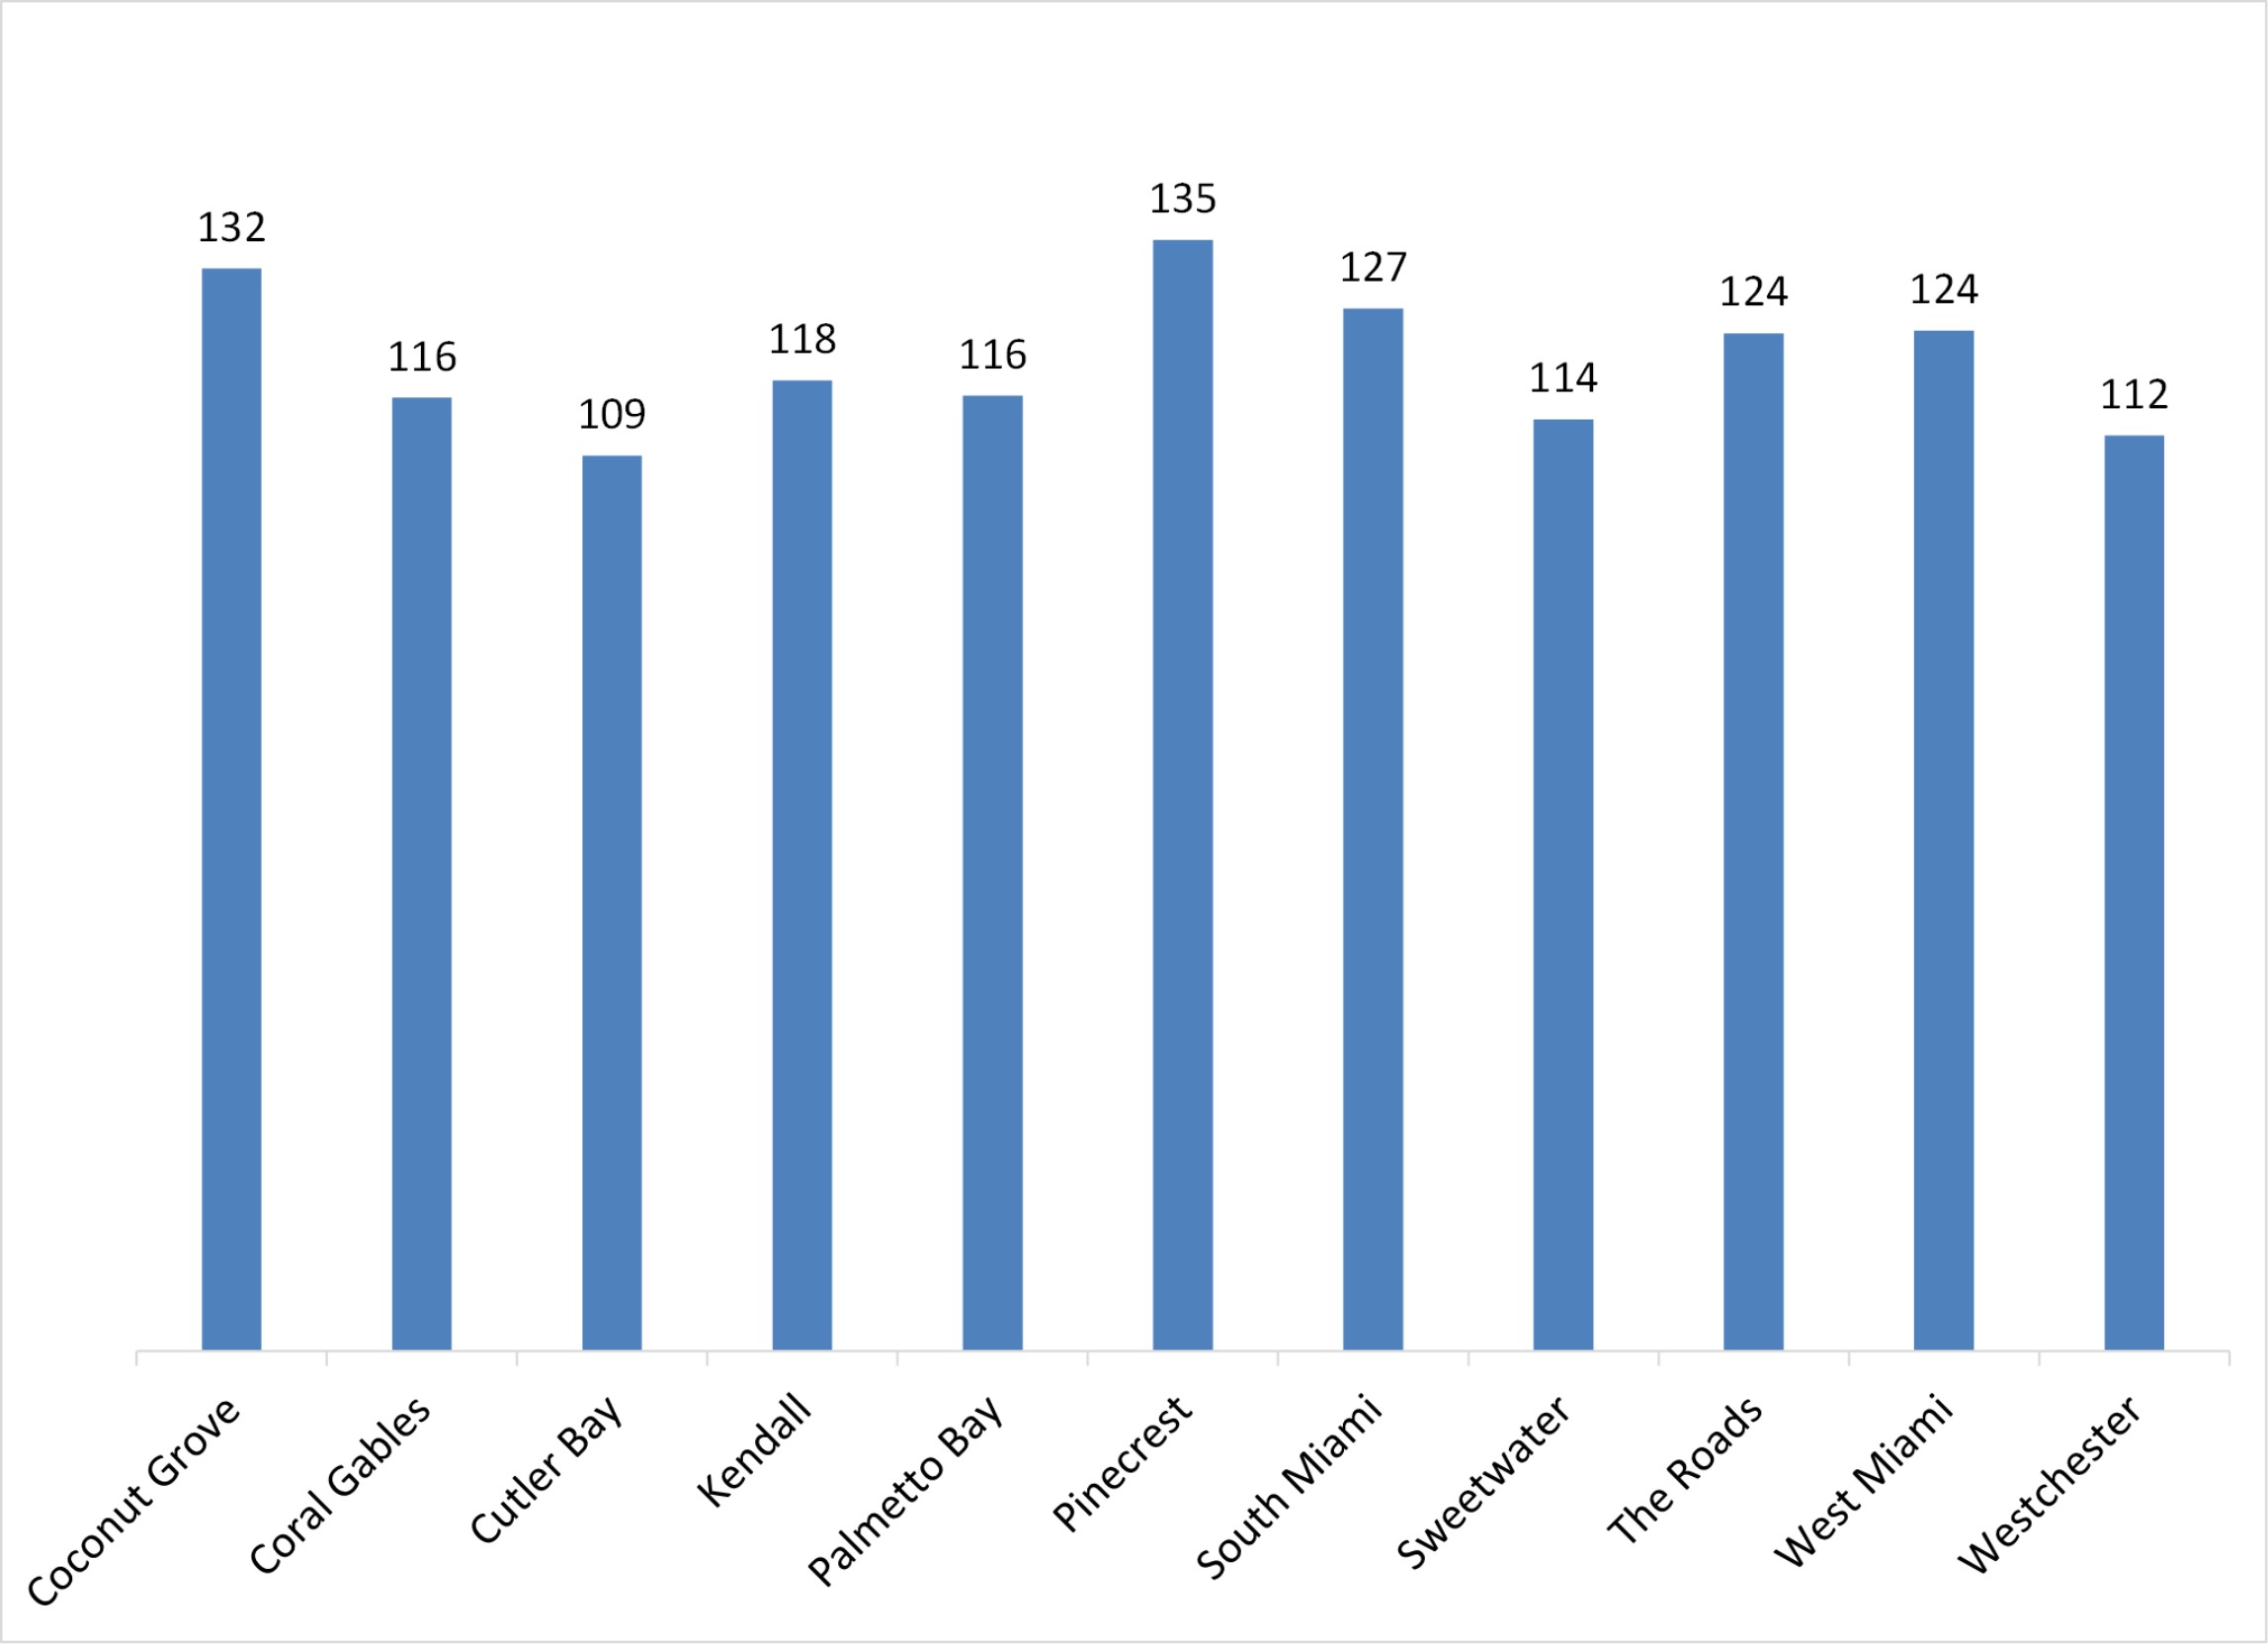
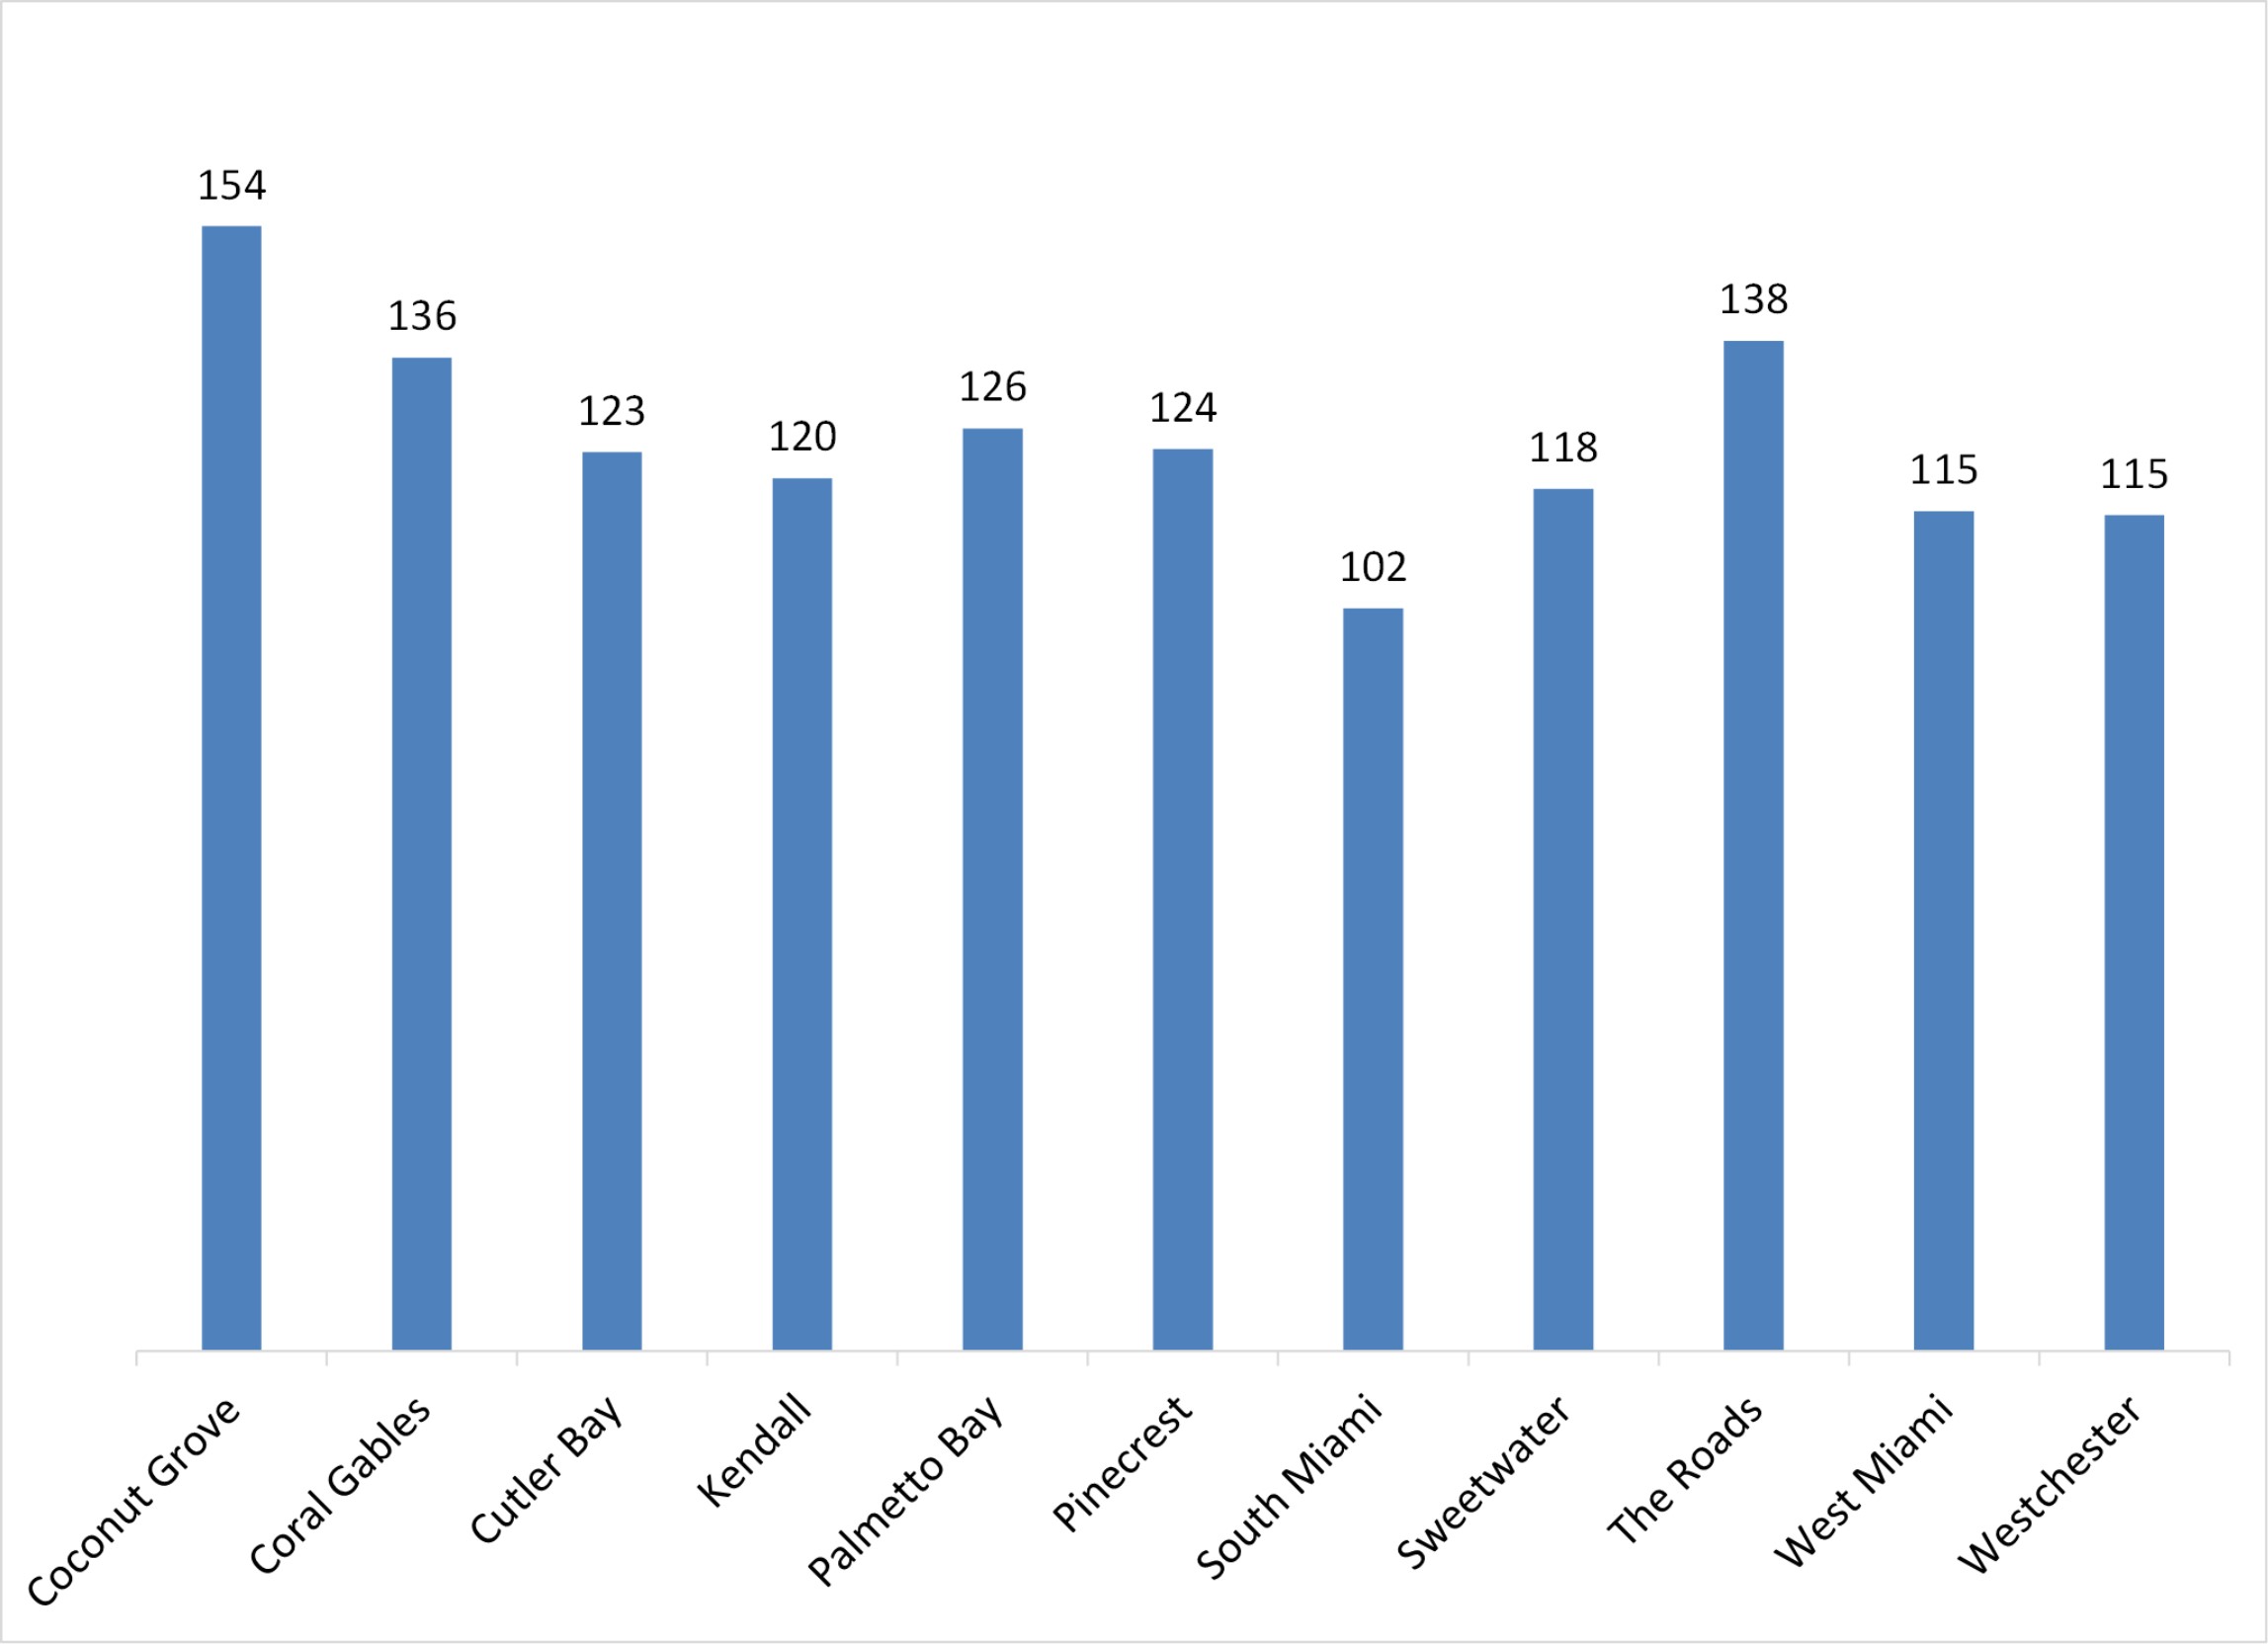
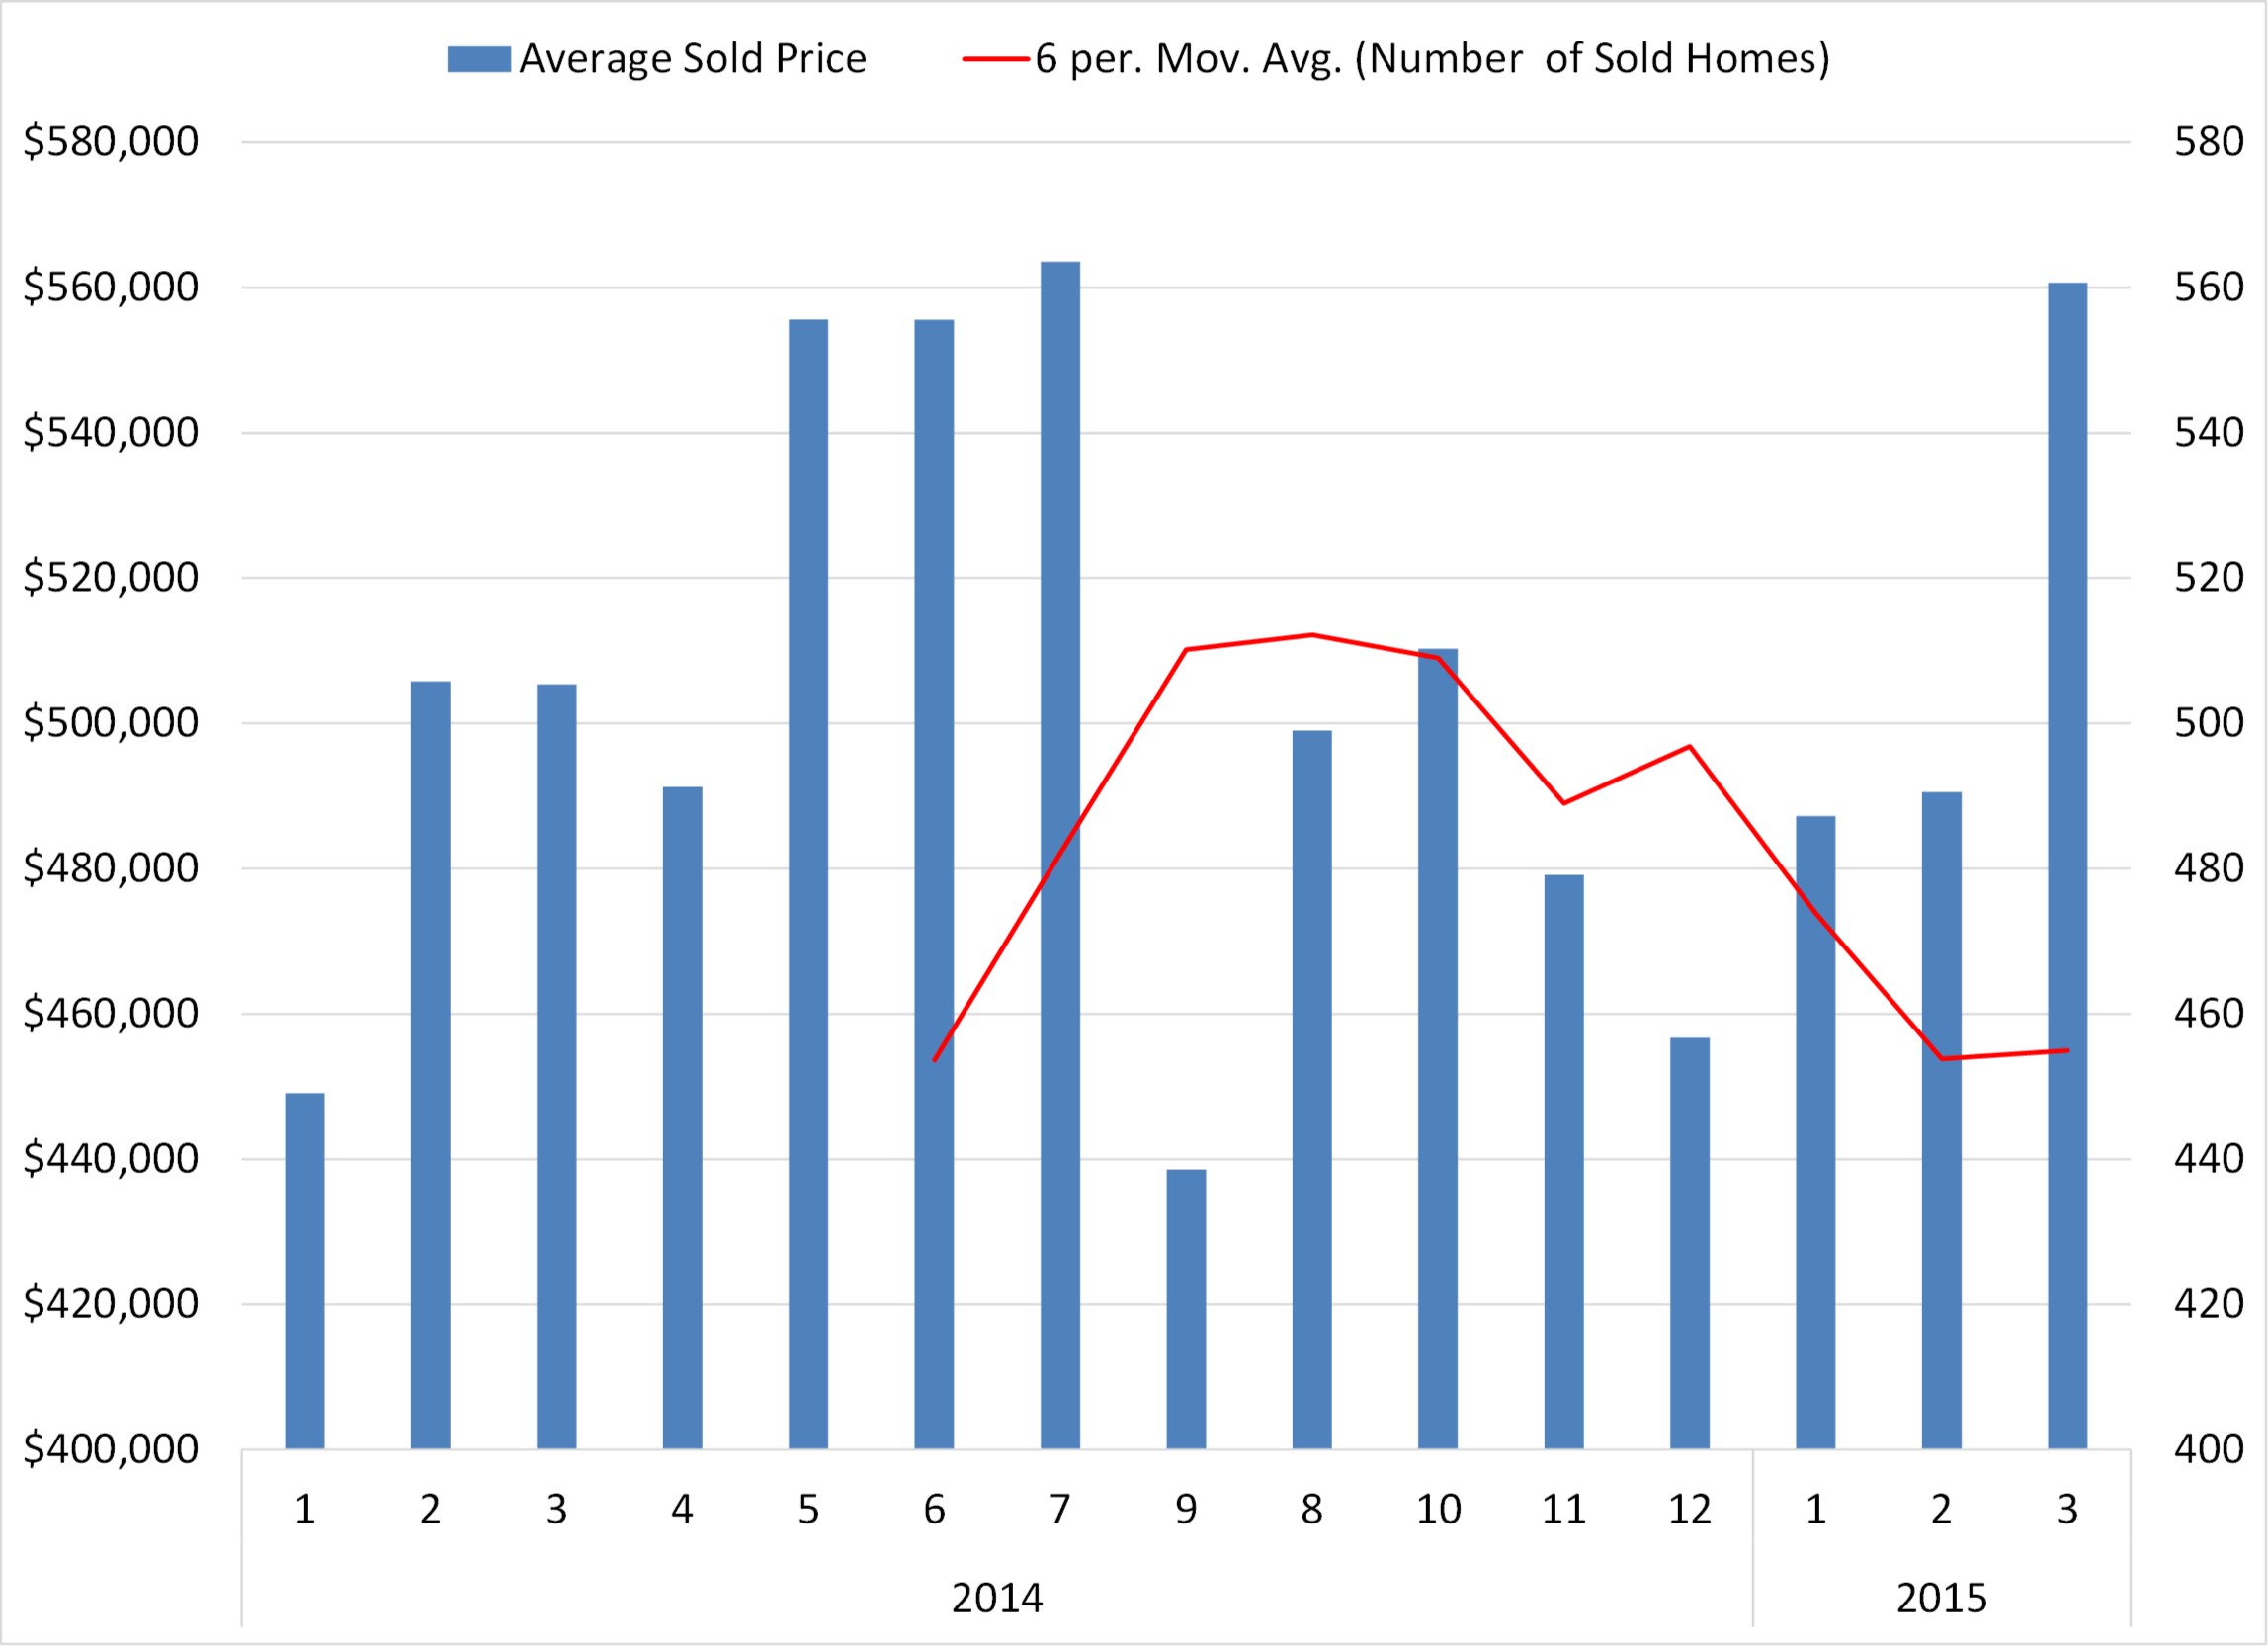
How long are single family homes staying in the market until they are sold? See below graph.

days on market single family home miami

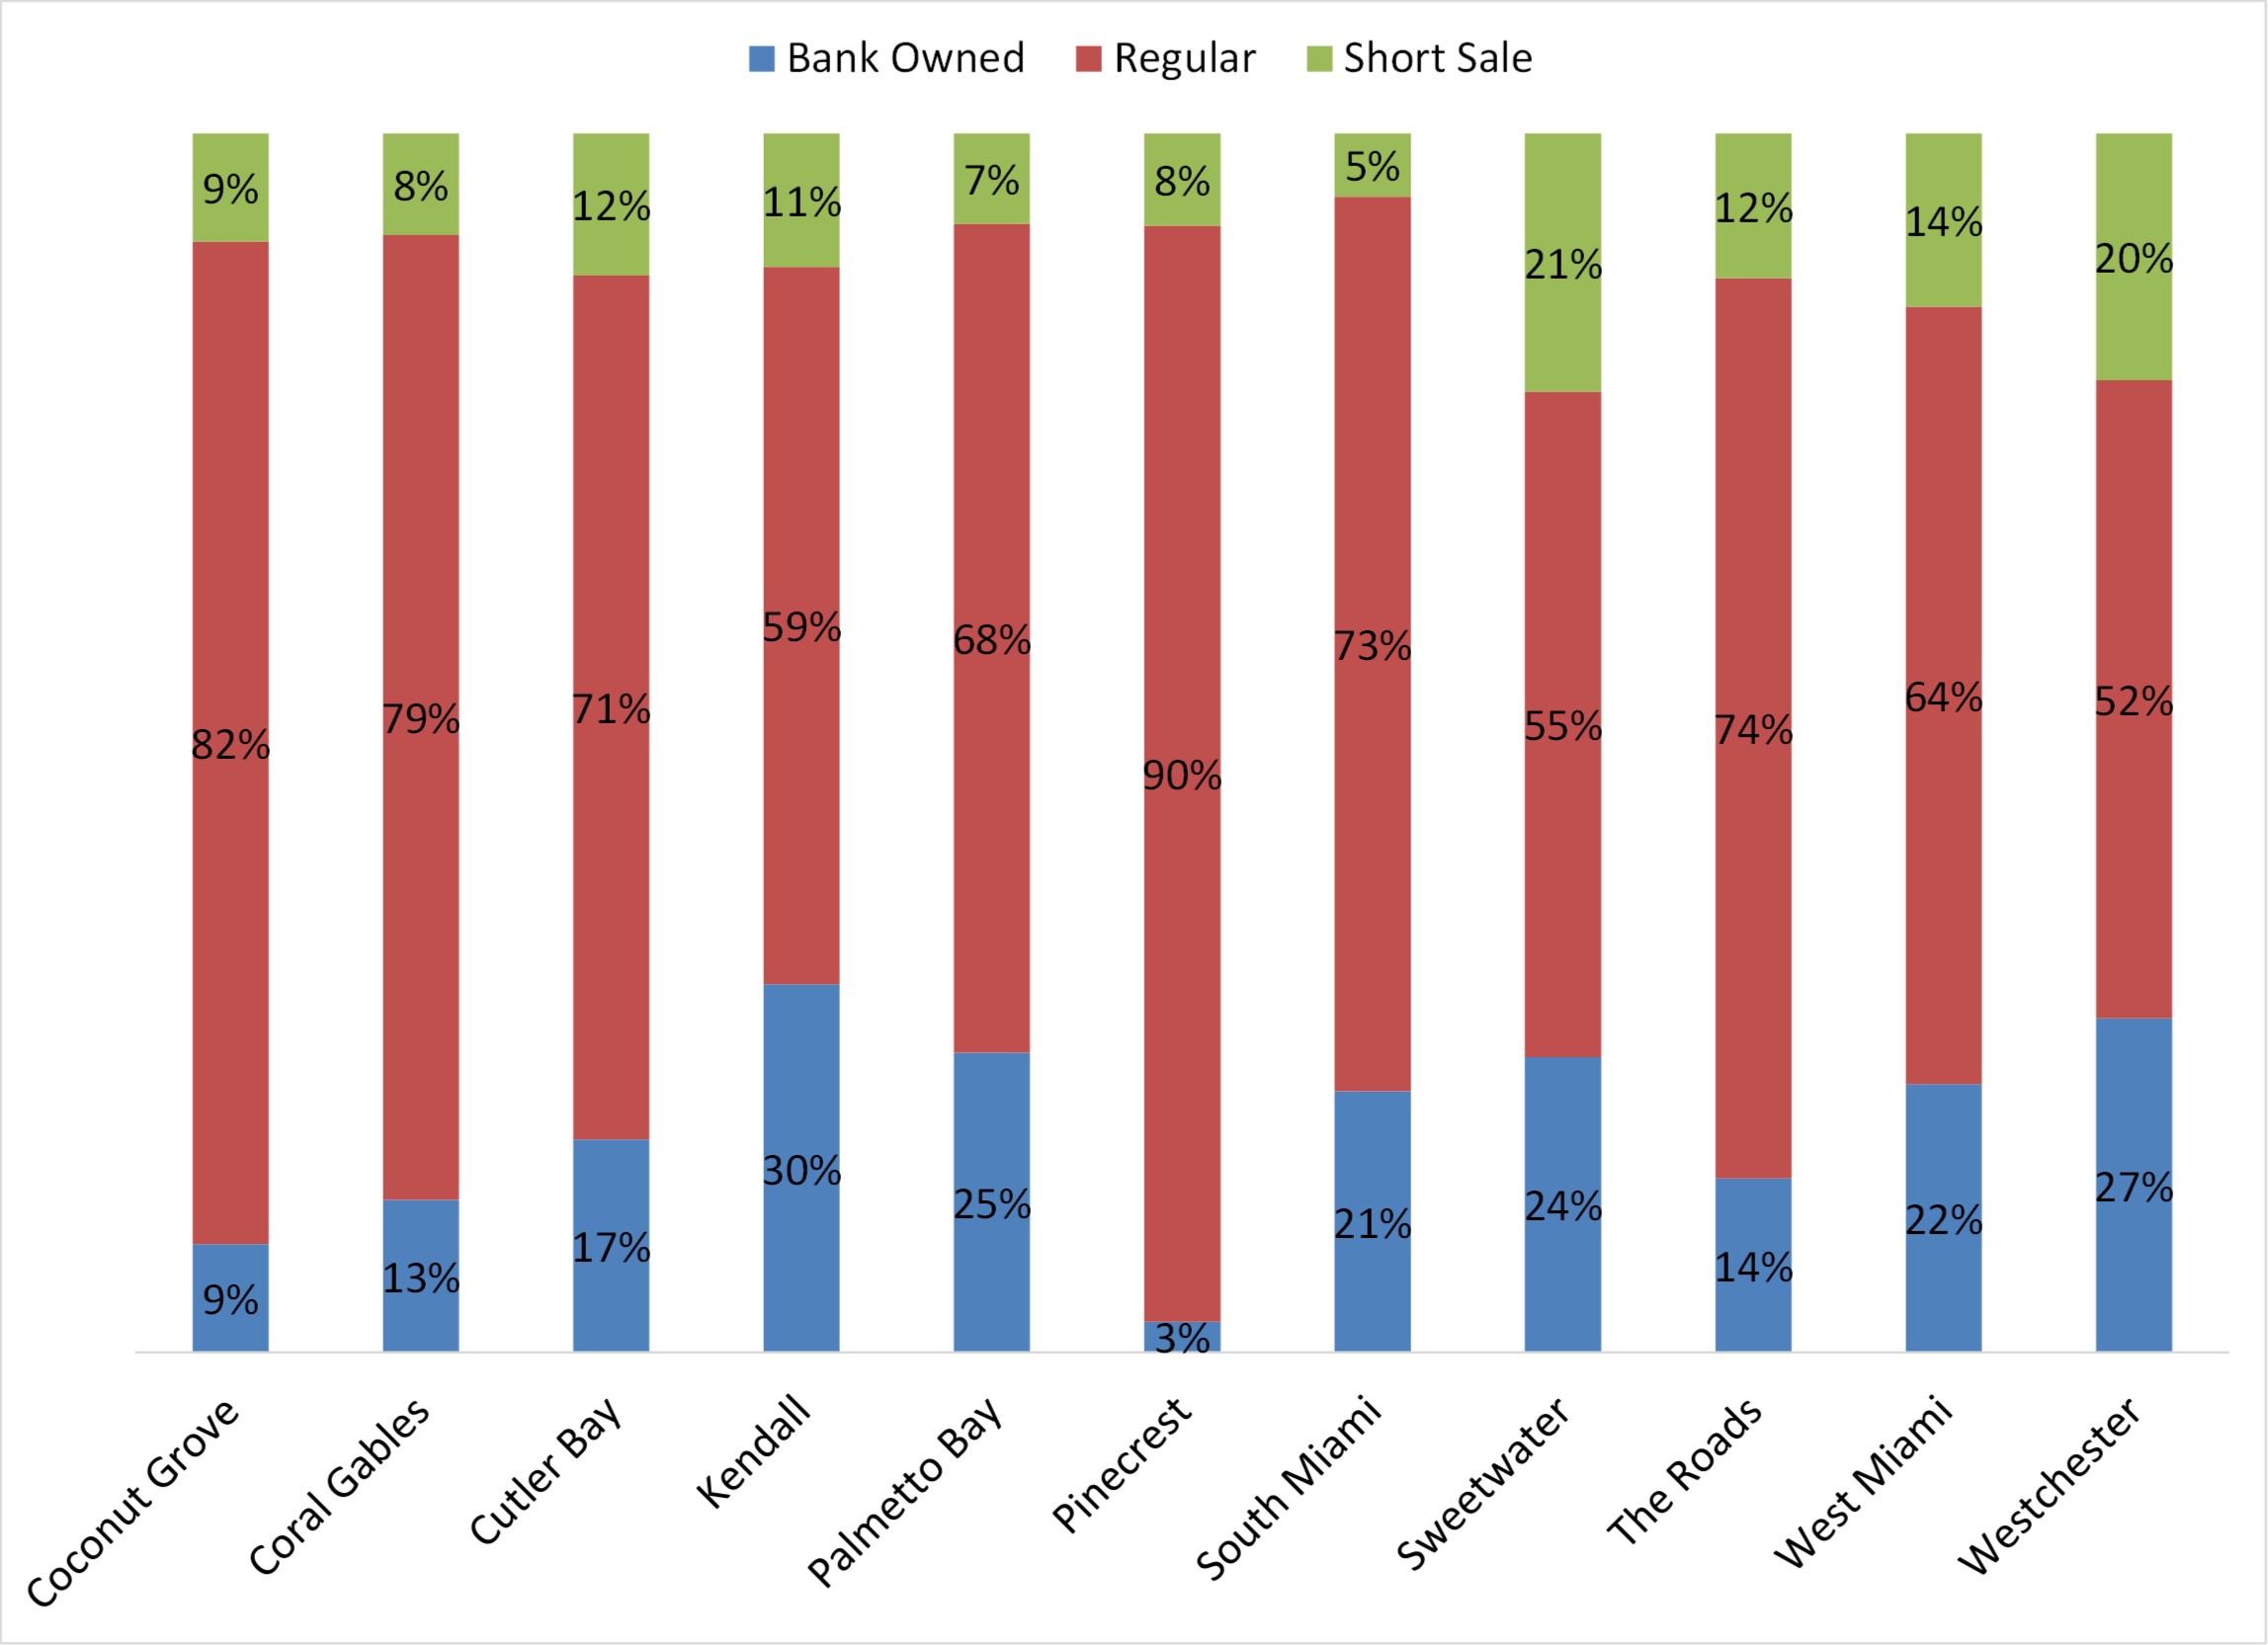
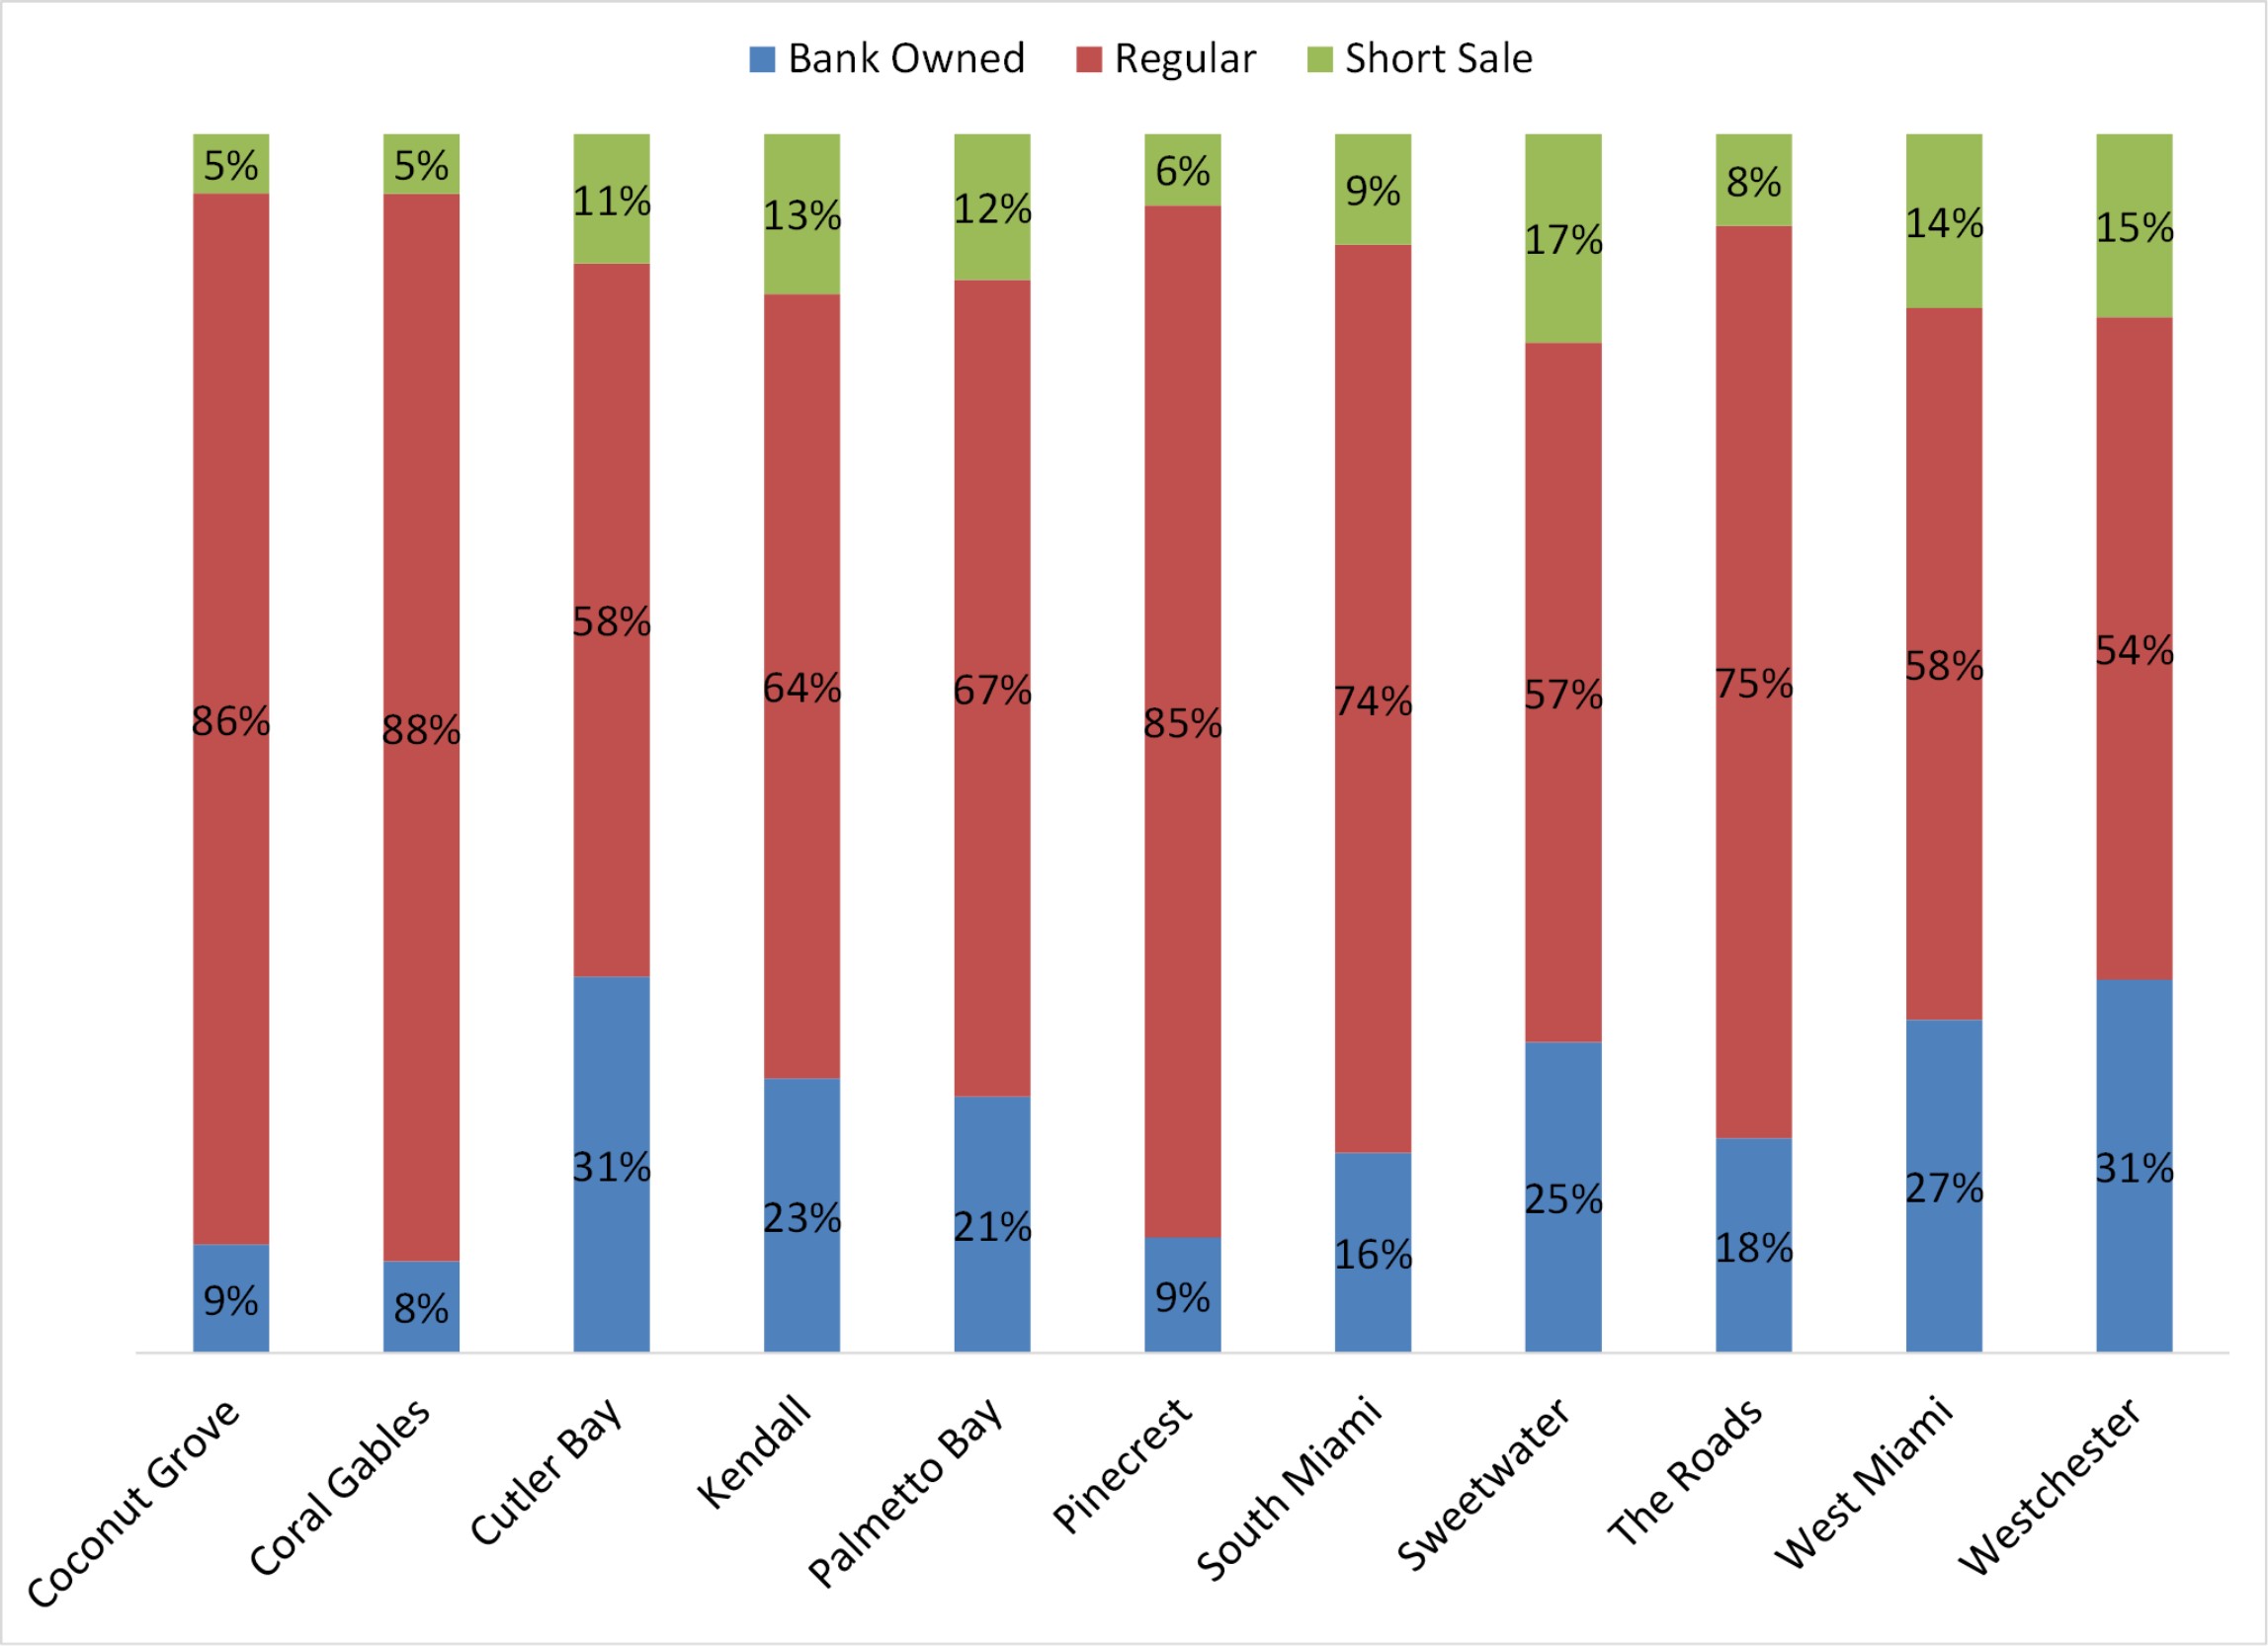
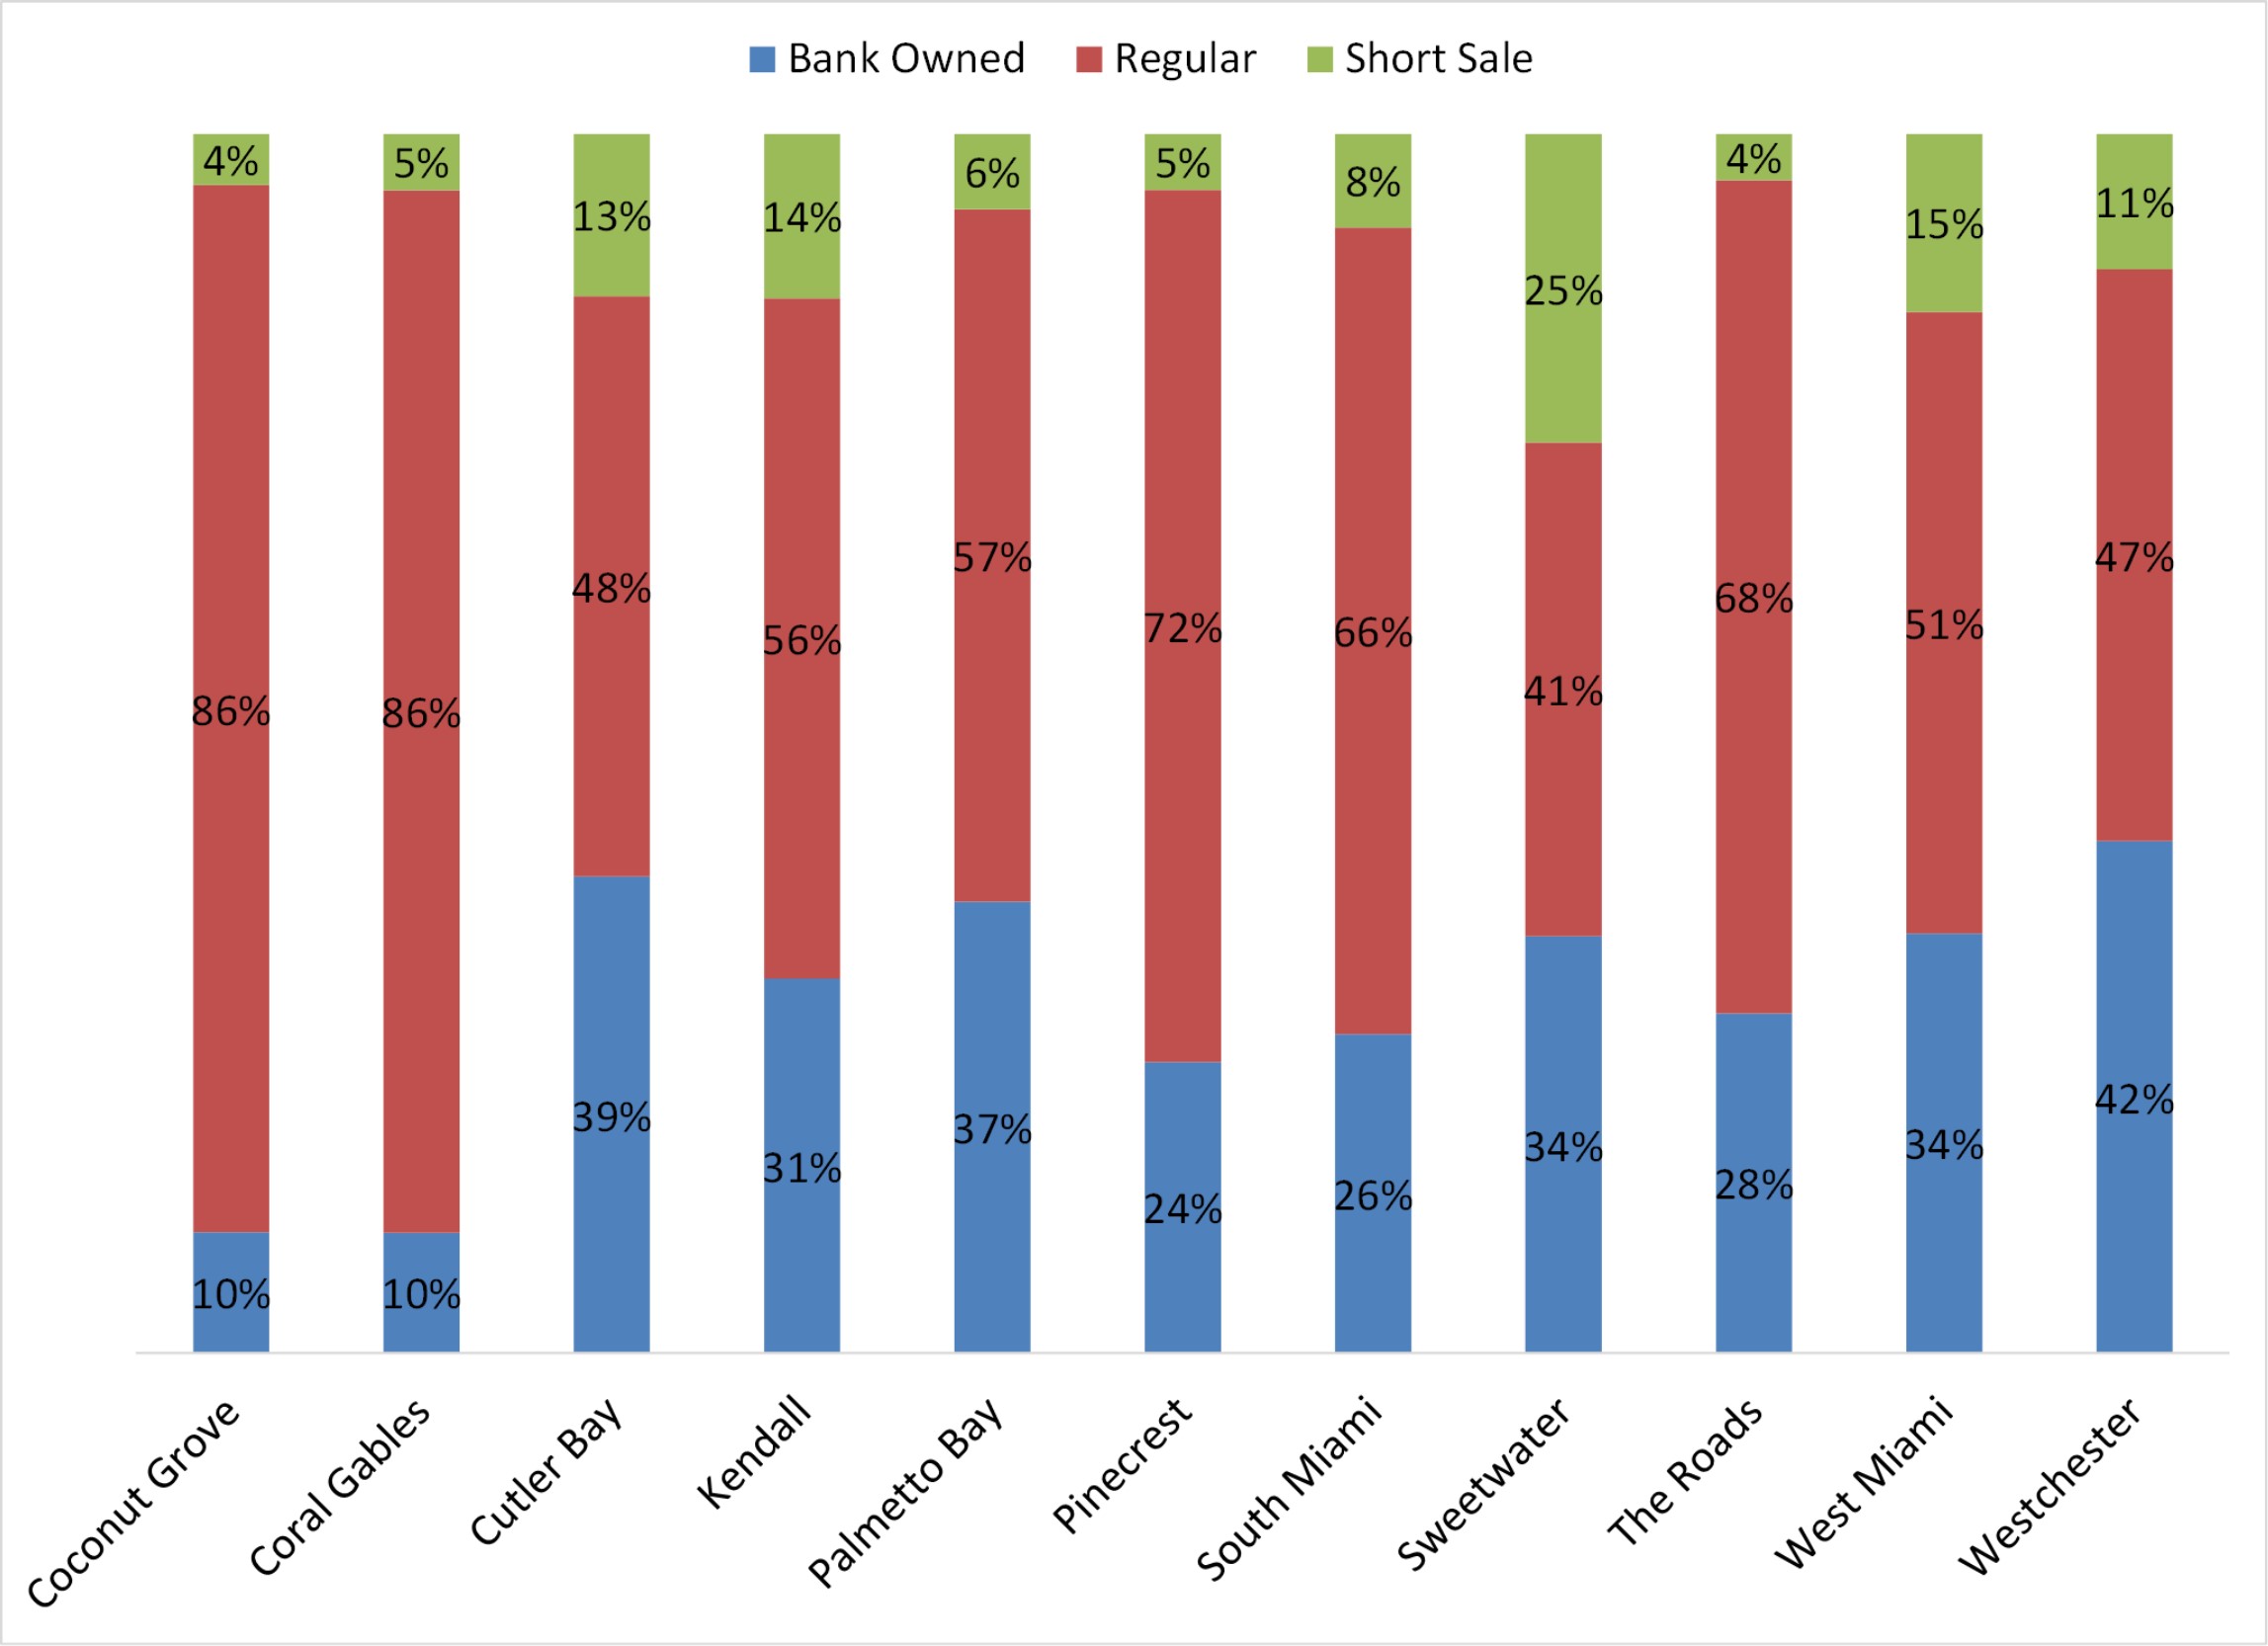
What type of sales are dominating your neighborhood? See below graph.

type of single family home sale in miami

Miami Home Prices Cool As We Exit 2014

In summary, number of sold properties continue to decline back to levels seen at the beginning of the year, and prices barely remain flat if you look back to Jan 2014.

What’s the outlook? Not much until we get passed the holiday season. History dictates low activity during this time of the year, and 2014 shows no exception with 390 properties sold in Nov at an average price of $479,000 throughout southern neighborhoods in Miami-Dade County.

price trend single fmaily homes


Average Single Family Home Price – Below graph details the comparison between the average home price YTD Nov 2010 versus YTD Nov 2014 by city.

price comparison single family homes


Days On Market For Single Family Homes – It’s taking approximately 123 days for a property to sell from the moment it enters the market YTD Nov 2014. This figure has virtually remained unchanged throughout 2014.  Surprisingly, homes located in “luxury areas” such as Coral Gables (115 days) or Pinecrest (138 days) have sold at a not so distant pace compared to more affordable locations such as Sweetwater (120 days) or Westchester (120 days).  Typically, luxury homes tend to stay in the market for sale for a longer period of time relative to middle income single family residences.

days on market single family homes


Transaction Type – Single Family – The below graph details the type of sales taking place by city YTD Nov 2014.  Coral Gables, Pinecrest, and Coconut Grove lead the pack with the lowest levels of short sales and foreclosure activity at just under 15% of total sales. This is pretty significant considering each of the other areas command short sales and foreclosure transactions at no less than about 30% of total units sold.  That’s double the amount!

type of sale single family homes

Single Family Prices Flat; Condo-Townhouses Spike

Overall, the single family residence market reflects a flat trend in both price appreciation and number of closings during the last four months (see below graph). These figures are expected to continue for the remainder of 2014 and well into 2015.

Why is this happening? Home values and borrower-income are reaching equilibrium.  In other words, consumers are buying at maximum home price based on their salary or comfort level.  Among other factors, for home values to go up, take-home-pay must increase.  Until then, unless home inventory or interest rates significantly drop, prices should remain flat.

trend sfr

With the exception of July, condos and townhouses are following the same pattern as single family residences (see below graph). This spike is July may be a result of home buyers opting not to purchase single family units, and rather go for the more affordable condo/townhome.

Above and below graphs contain combined pricing and volume data for the following cities: Coconut Grove, Coral Gables, Cutler Bay, Kendall, Palmetto Bay, Pinecrest, South Miami, Sweetwater, The Roads, West Miami and Westchester.

trend th condo

Average Home Price – Single Family – Year-to-date July 2010 vs Year-to-date July 2014 – Below graph details the comparison between the average home price in 2010 versus 2014 by city.

ave price sfr

Average Home Price – Condo/Town Home – Year-to-date July 2010 vs Year-to-date July 2014 – Below graph details the comparison between the average home price in 2010 versus 2014 by city.

ave price th condo

Days On Market or DOM – Single Family – Year-to-date July 2014 – The below chart shows the number of days a property stays in the market for sale until it is sold.

dom sfr

Days On Market or DOM – Condo/Town Home – Year-to-date July 2014 – The below chart shows the number of days a property stays in the market for sale until it is sold.

dom th condo

Transaction Type – Single Family – Year-to-date July 2014 – The below graph details the type of sales taking place by city.

type sfr

Transaction Type – Condo/Town Home – Year-to-date July 2014 – The below graph details the type of sales taking place by city.

type th condo