Single Family Prices Flat; Condo-Townhouses Spike

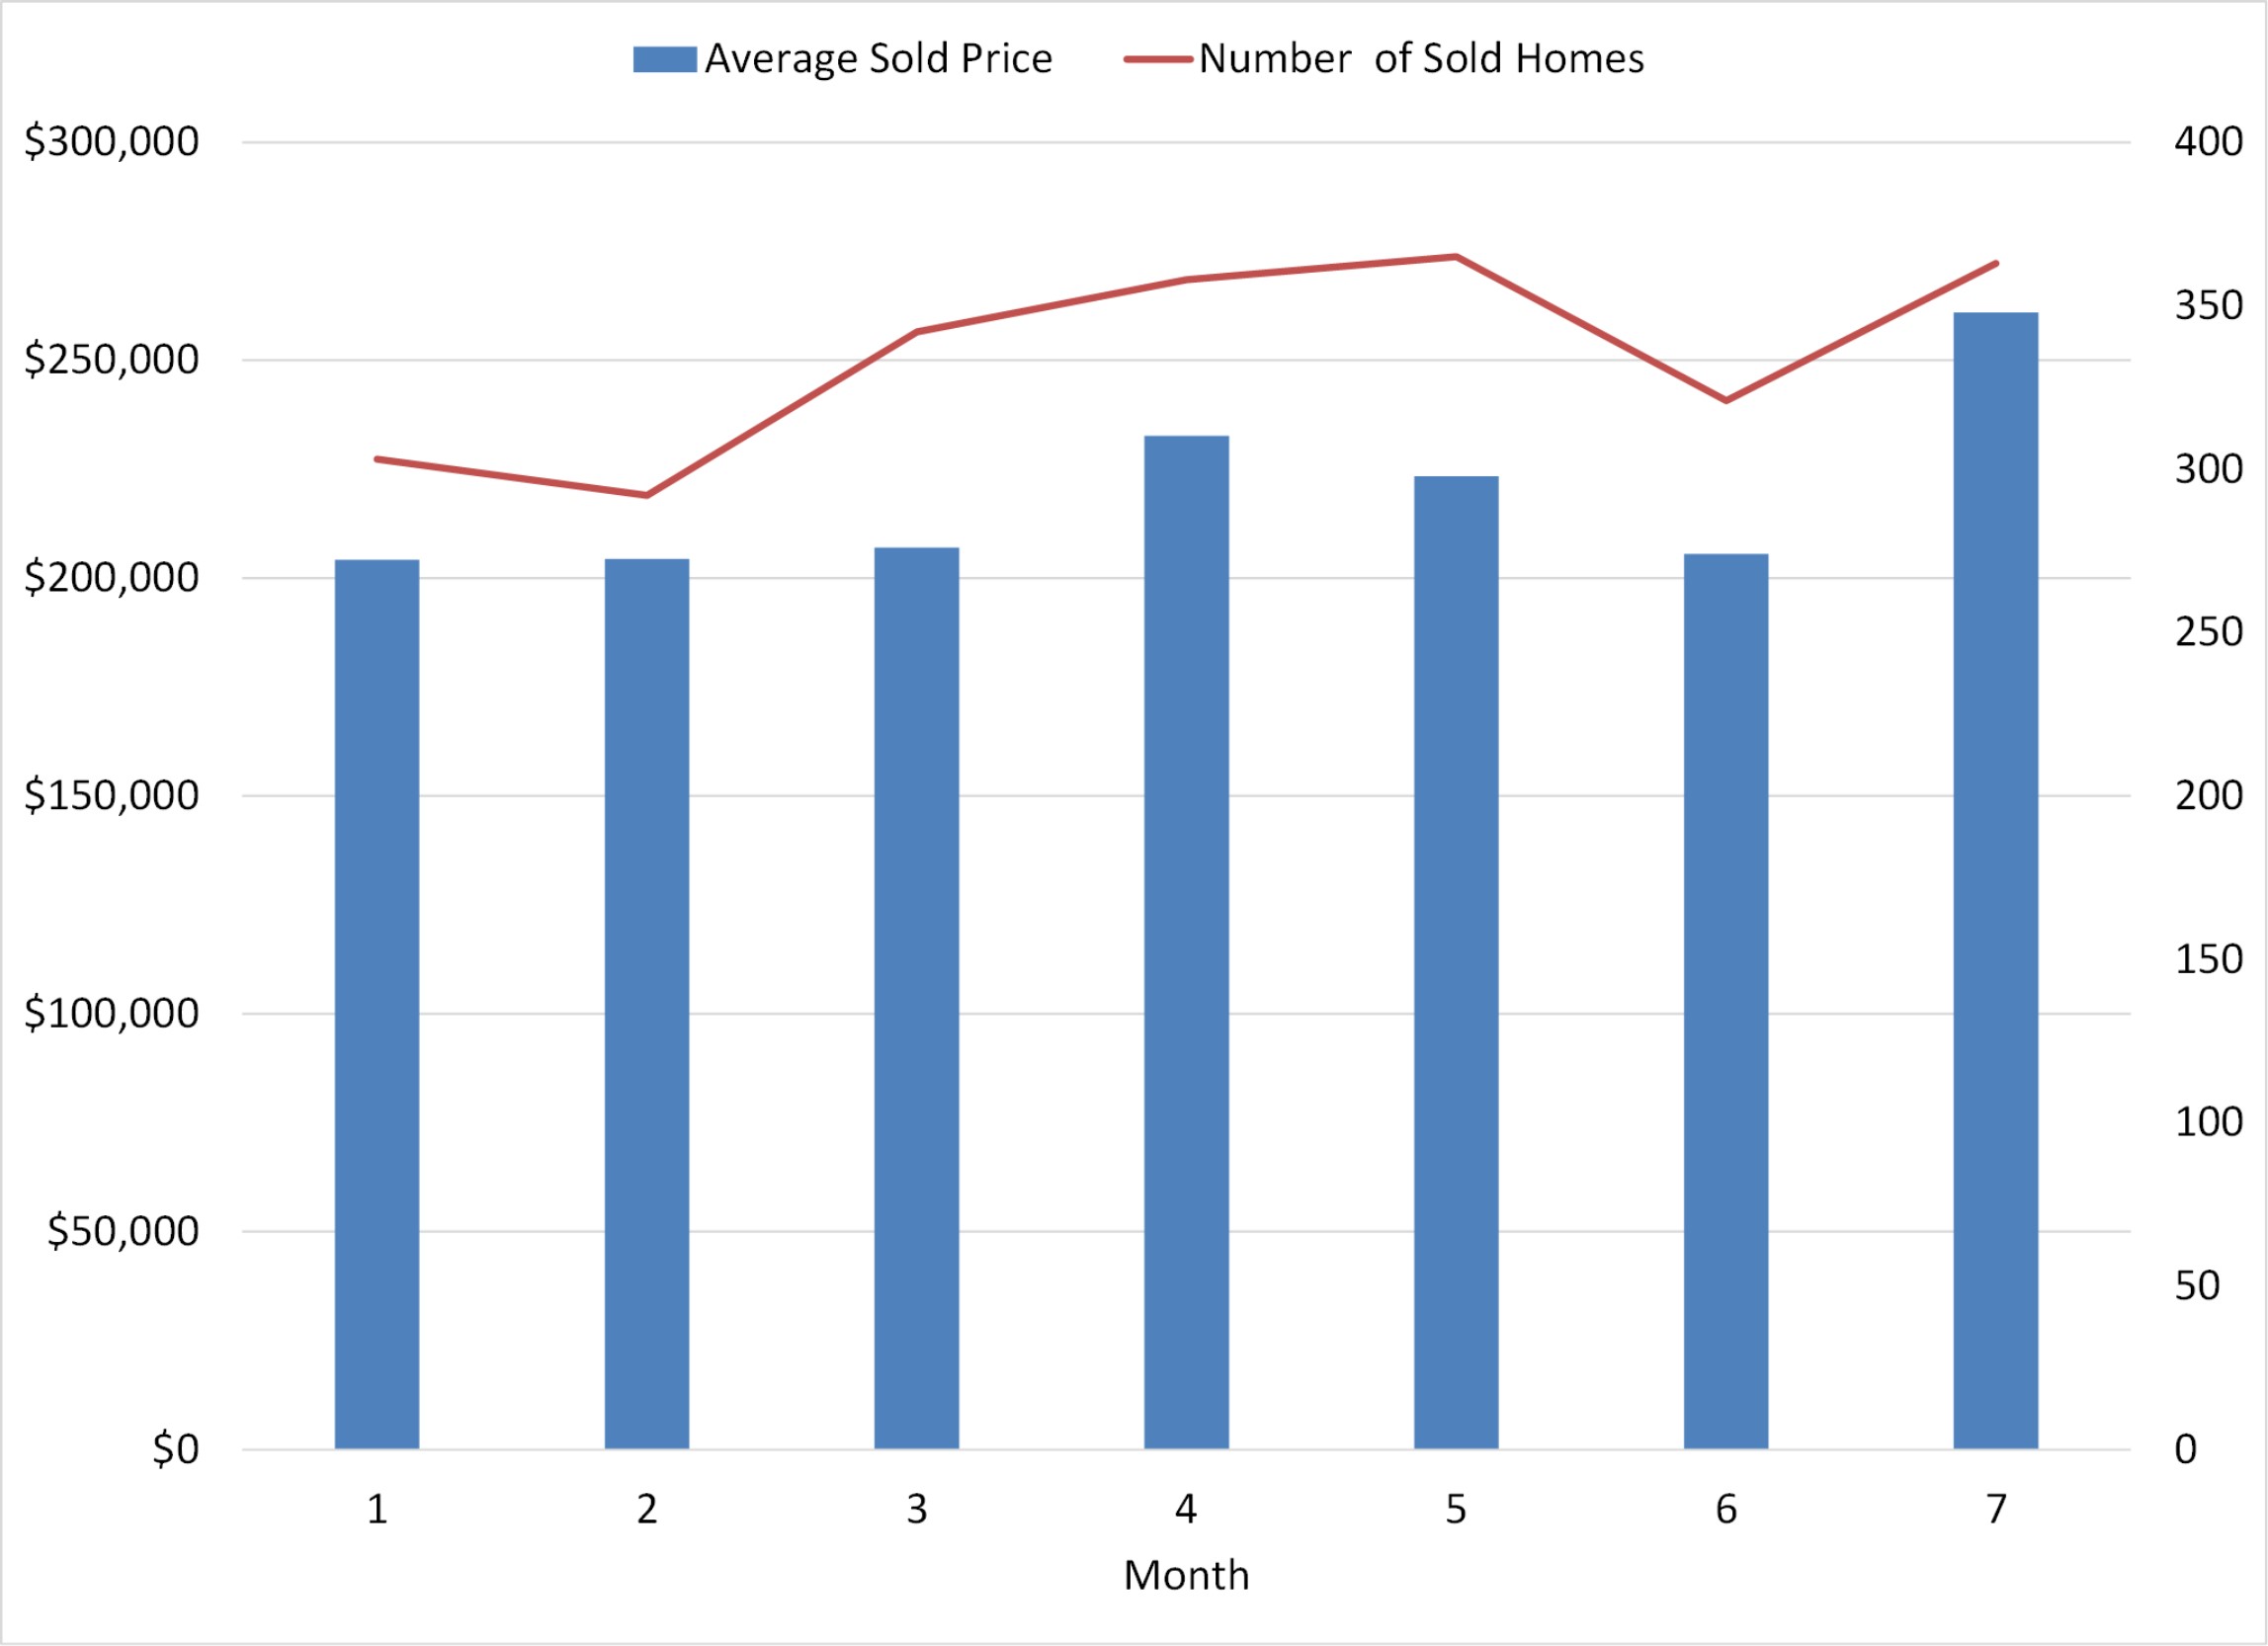
Overall, the single family residence market reflects a flat trend in both price appreciation and number of closings during the last four months (see below graph). These figures are expected to continue for the remainder of 2014 and well into 2015.

Why is this happening? Home values and borrower-income are reaching equilibrium.  In other words, consumers are buying at maximum home price based on their salary or comfort level.  Among other factors, for home values to go up, take-home-pay must increase.  Until then, unless home inventory or interest rates significantly drop, prices should remain flat.

trend sfr

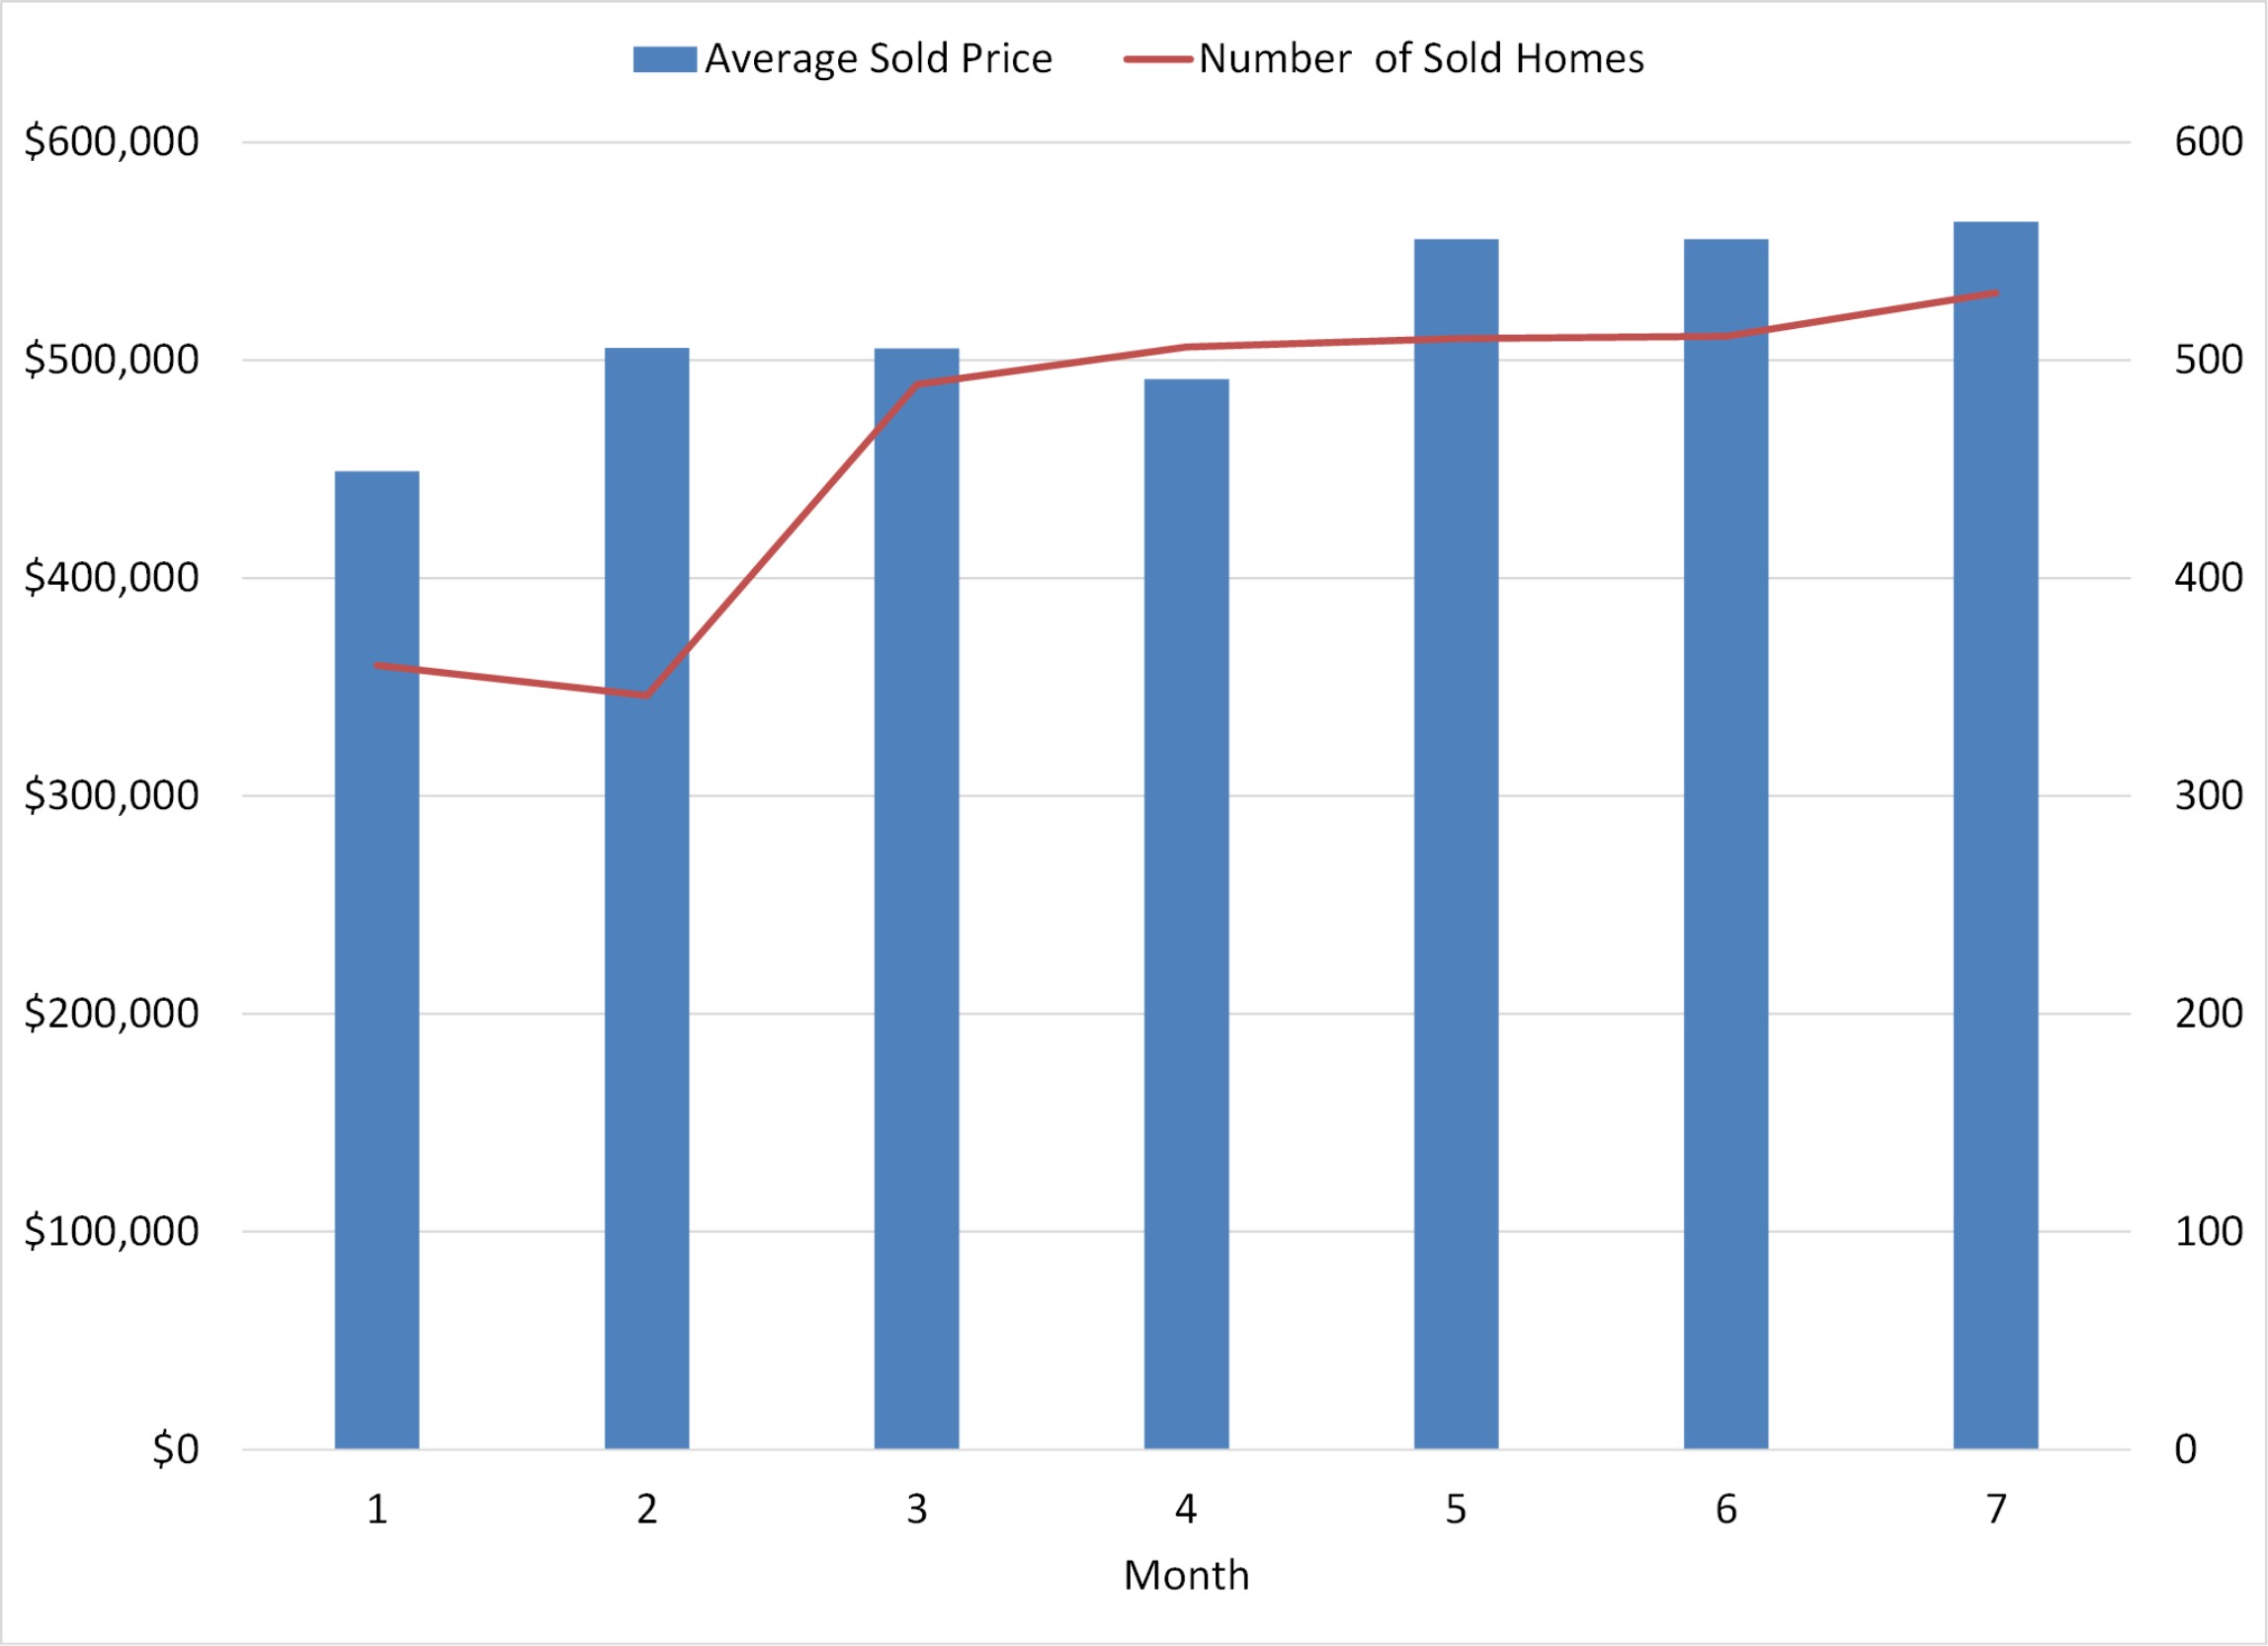
With the exception of July, condos and townhouses are following the same pattern as single family residences (see below graph). This spike is July may be a result of home buyers opting not to purchase single family units, and rather go for the more affordable condo/townhome.

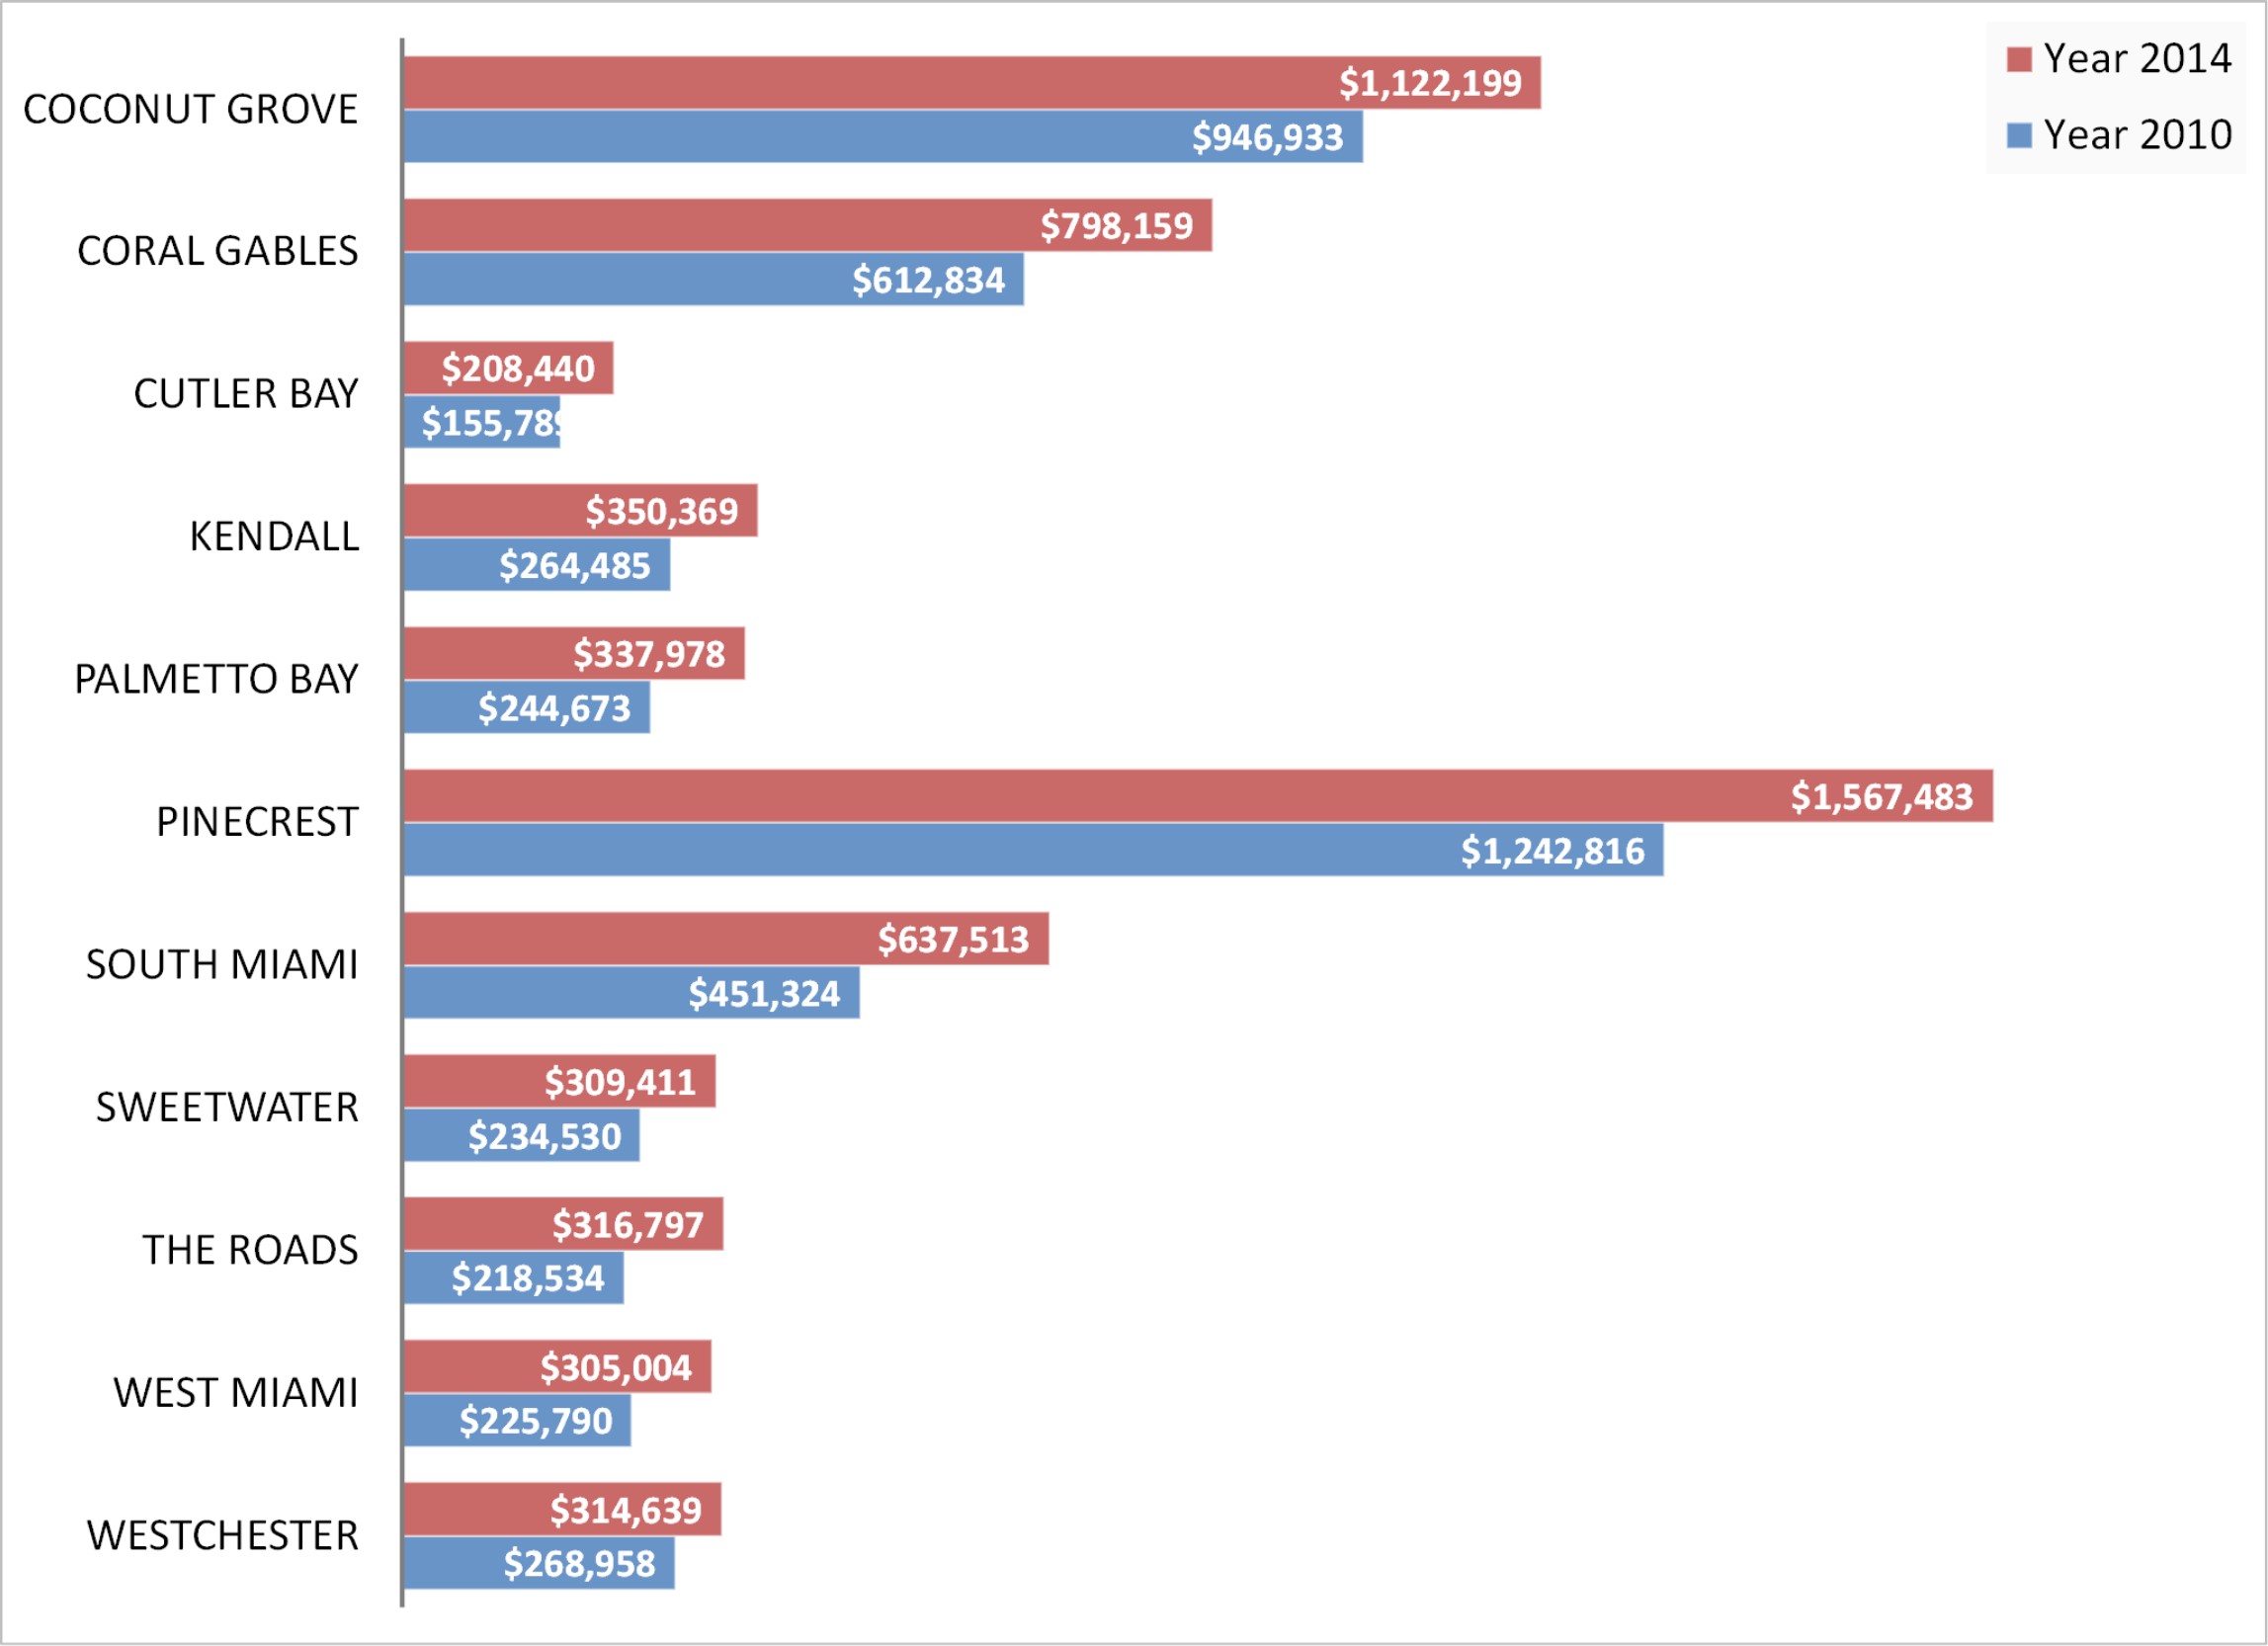
Above and below graphs contain combined pricing and volume data for the following cities: Coconut Grove, Coral Gables, Cutler Bay, Kendall, Palmetto Bay, Pinecrest, South Miami, Sweetwater, The Roads, West Miami and Westchester.

trend th condo

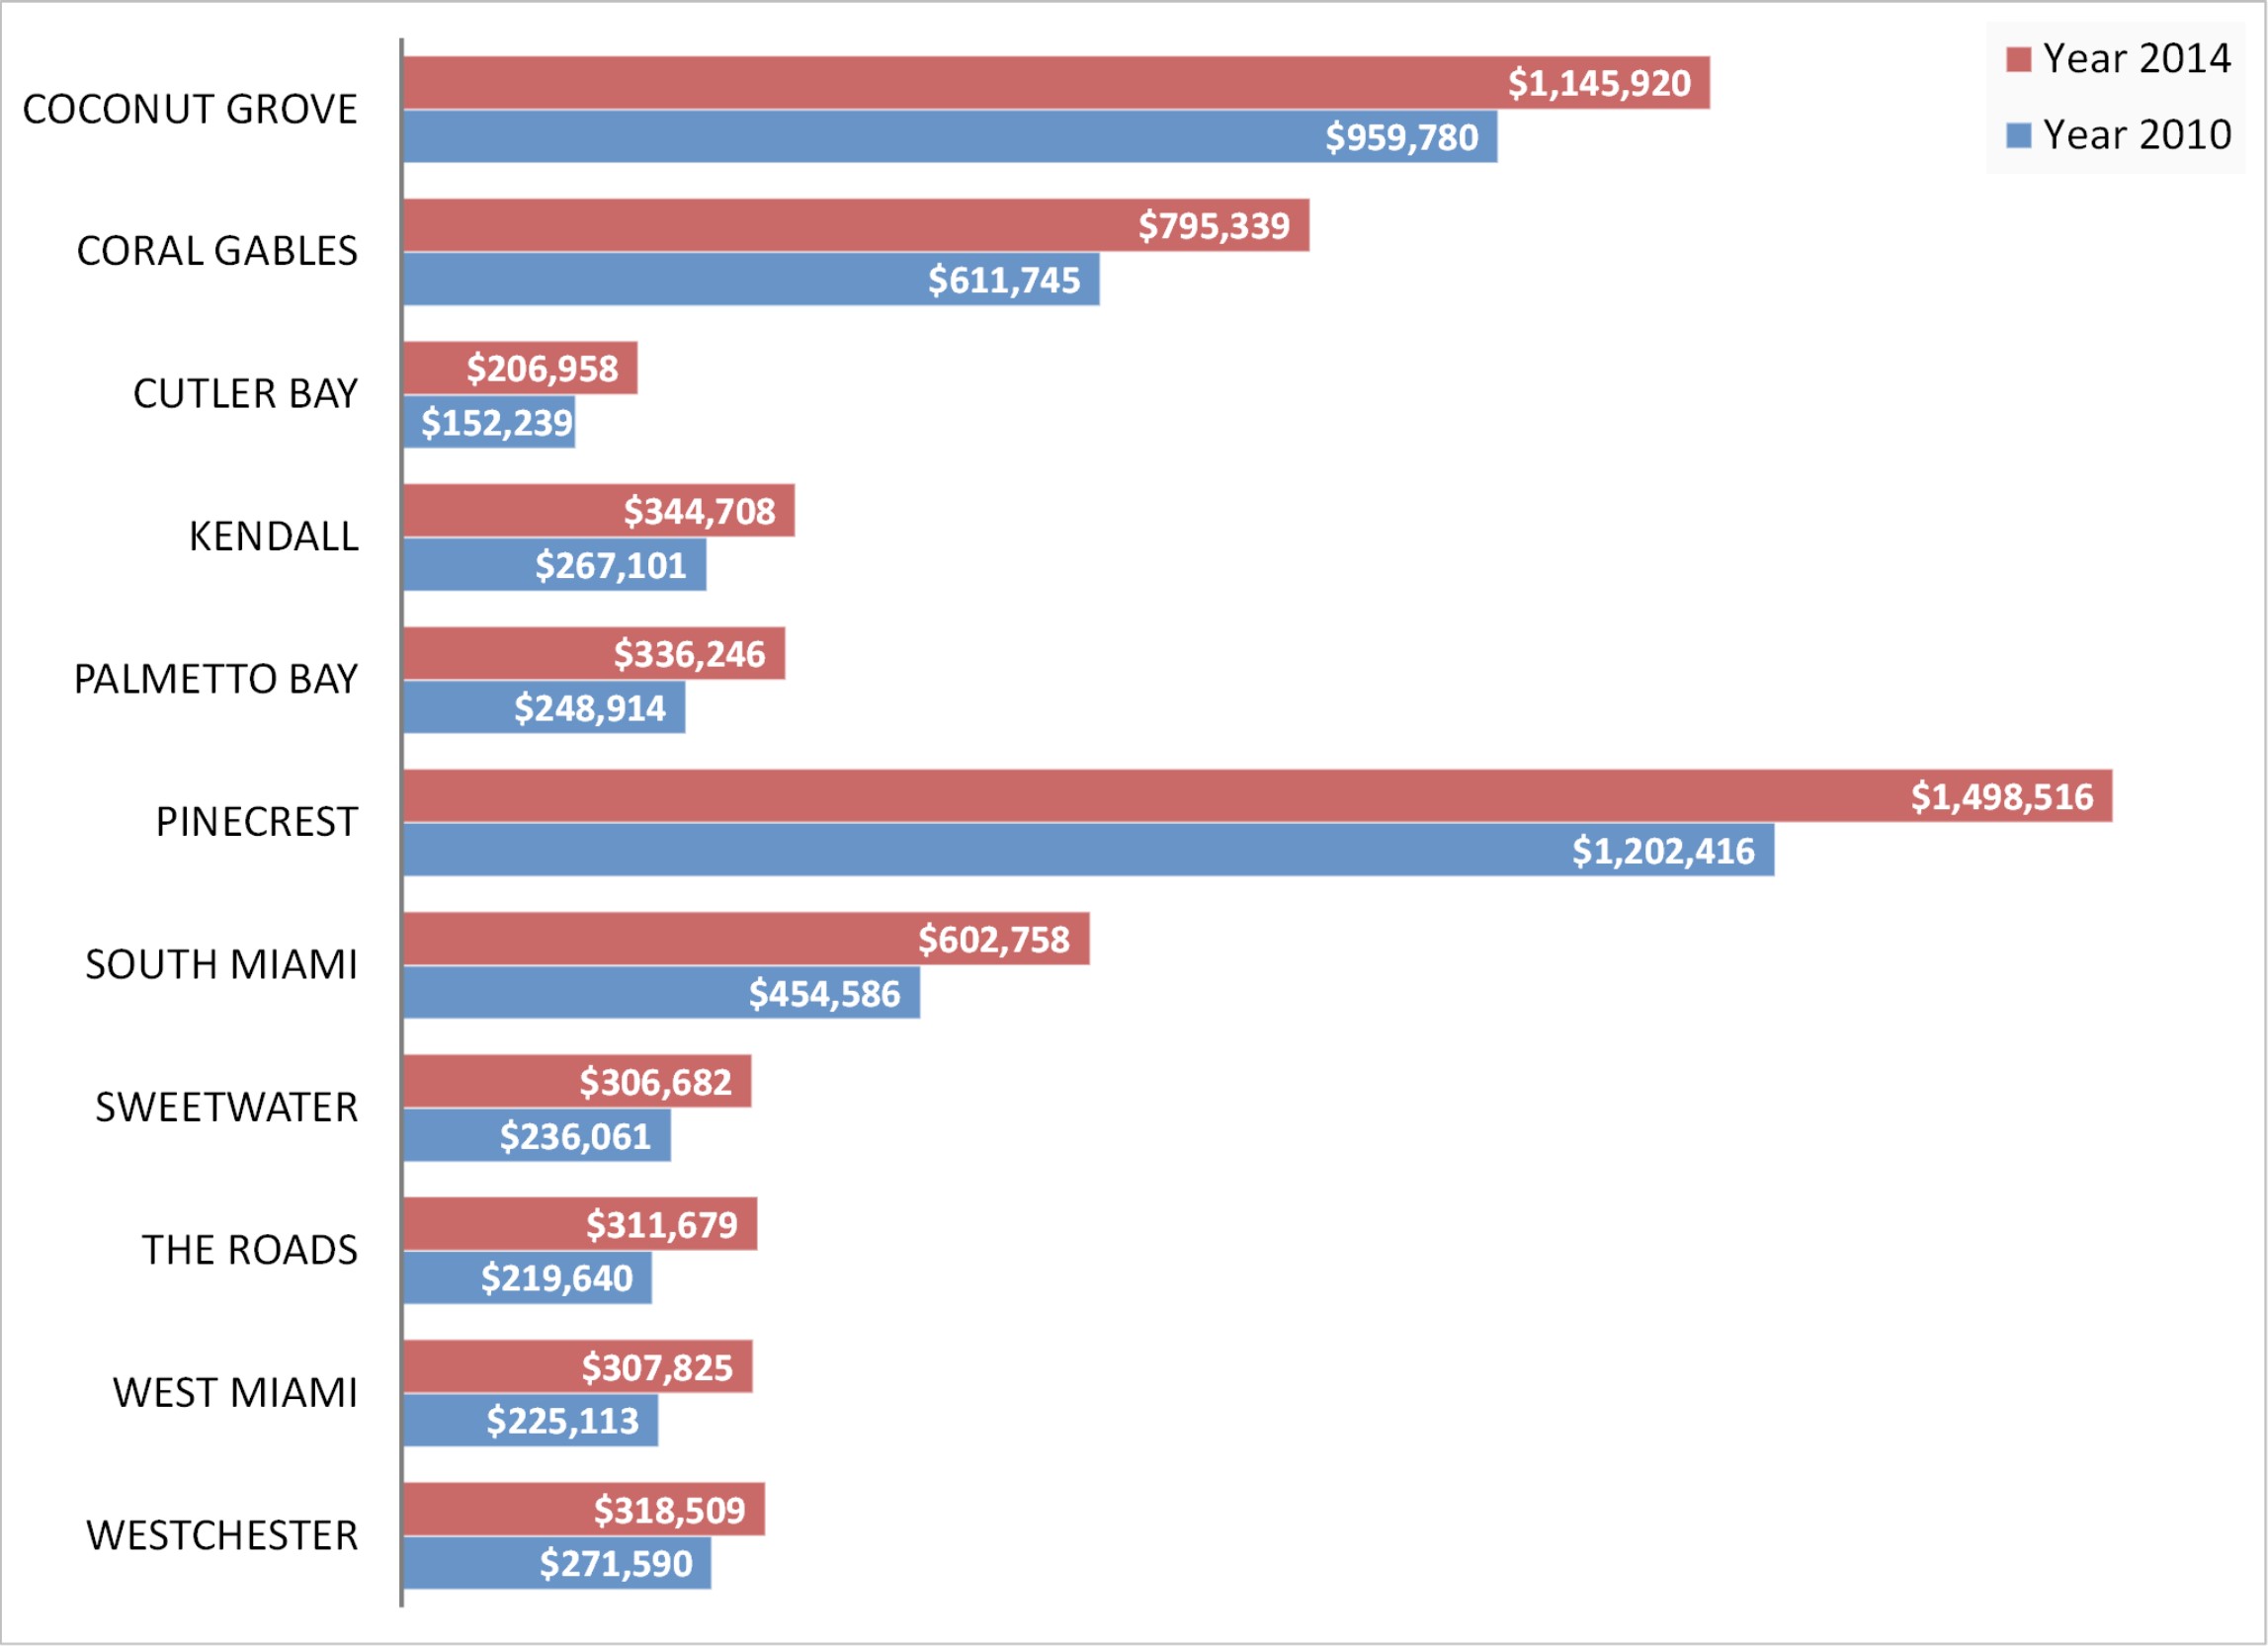
Average Home Price – Single Family – Year-to-date July 2010 vs Year-to-date July 2014 – Below graph details the comparison between the average home price in 2010 versus 2014 by city.

ave price sfr

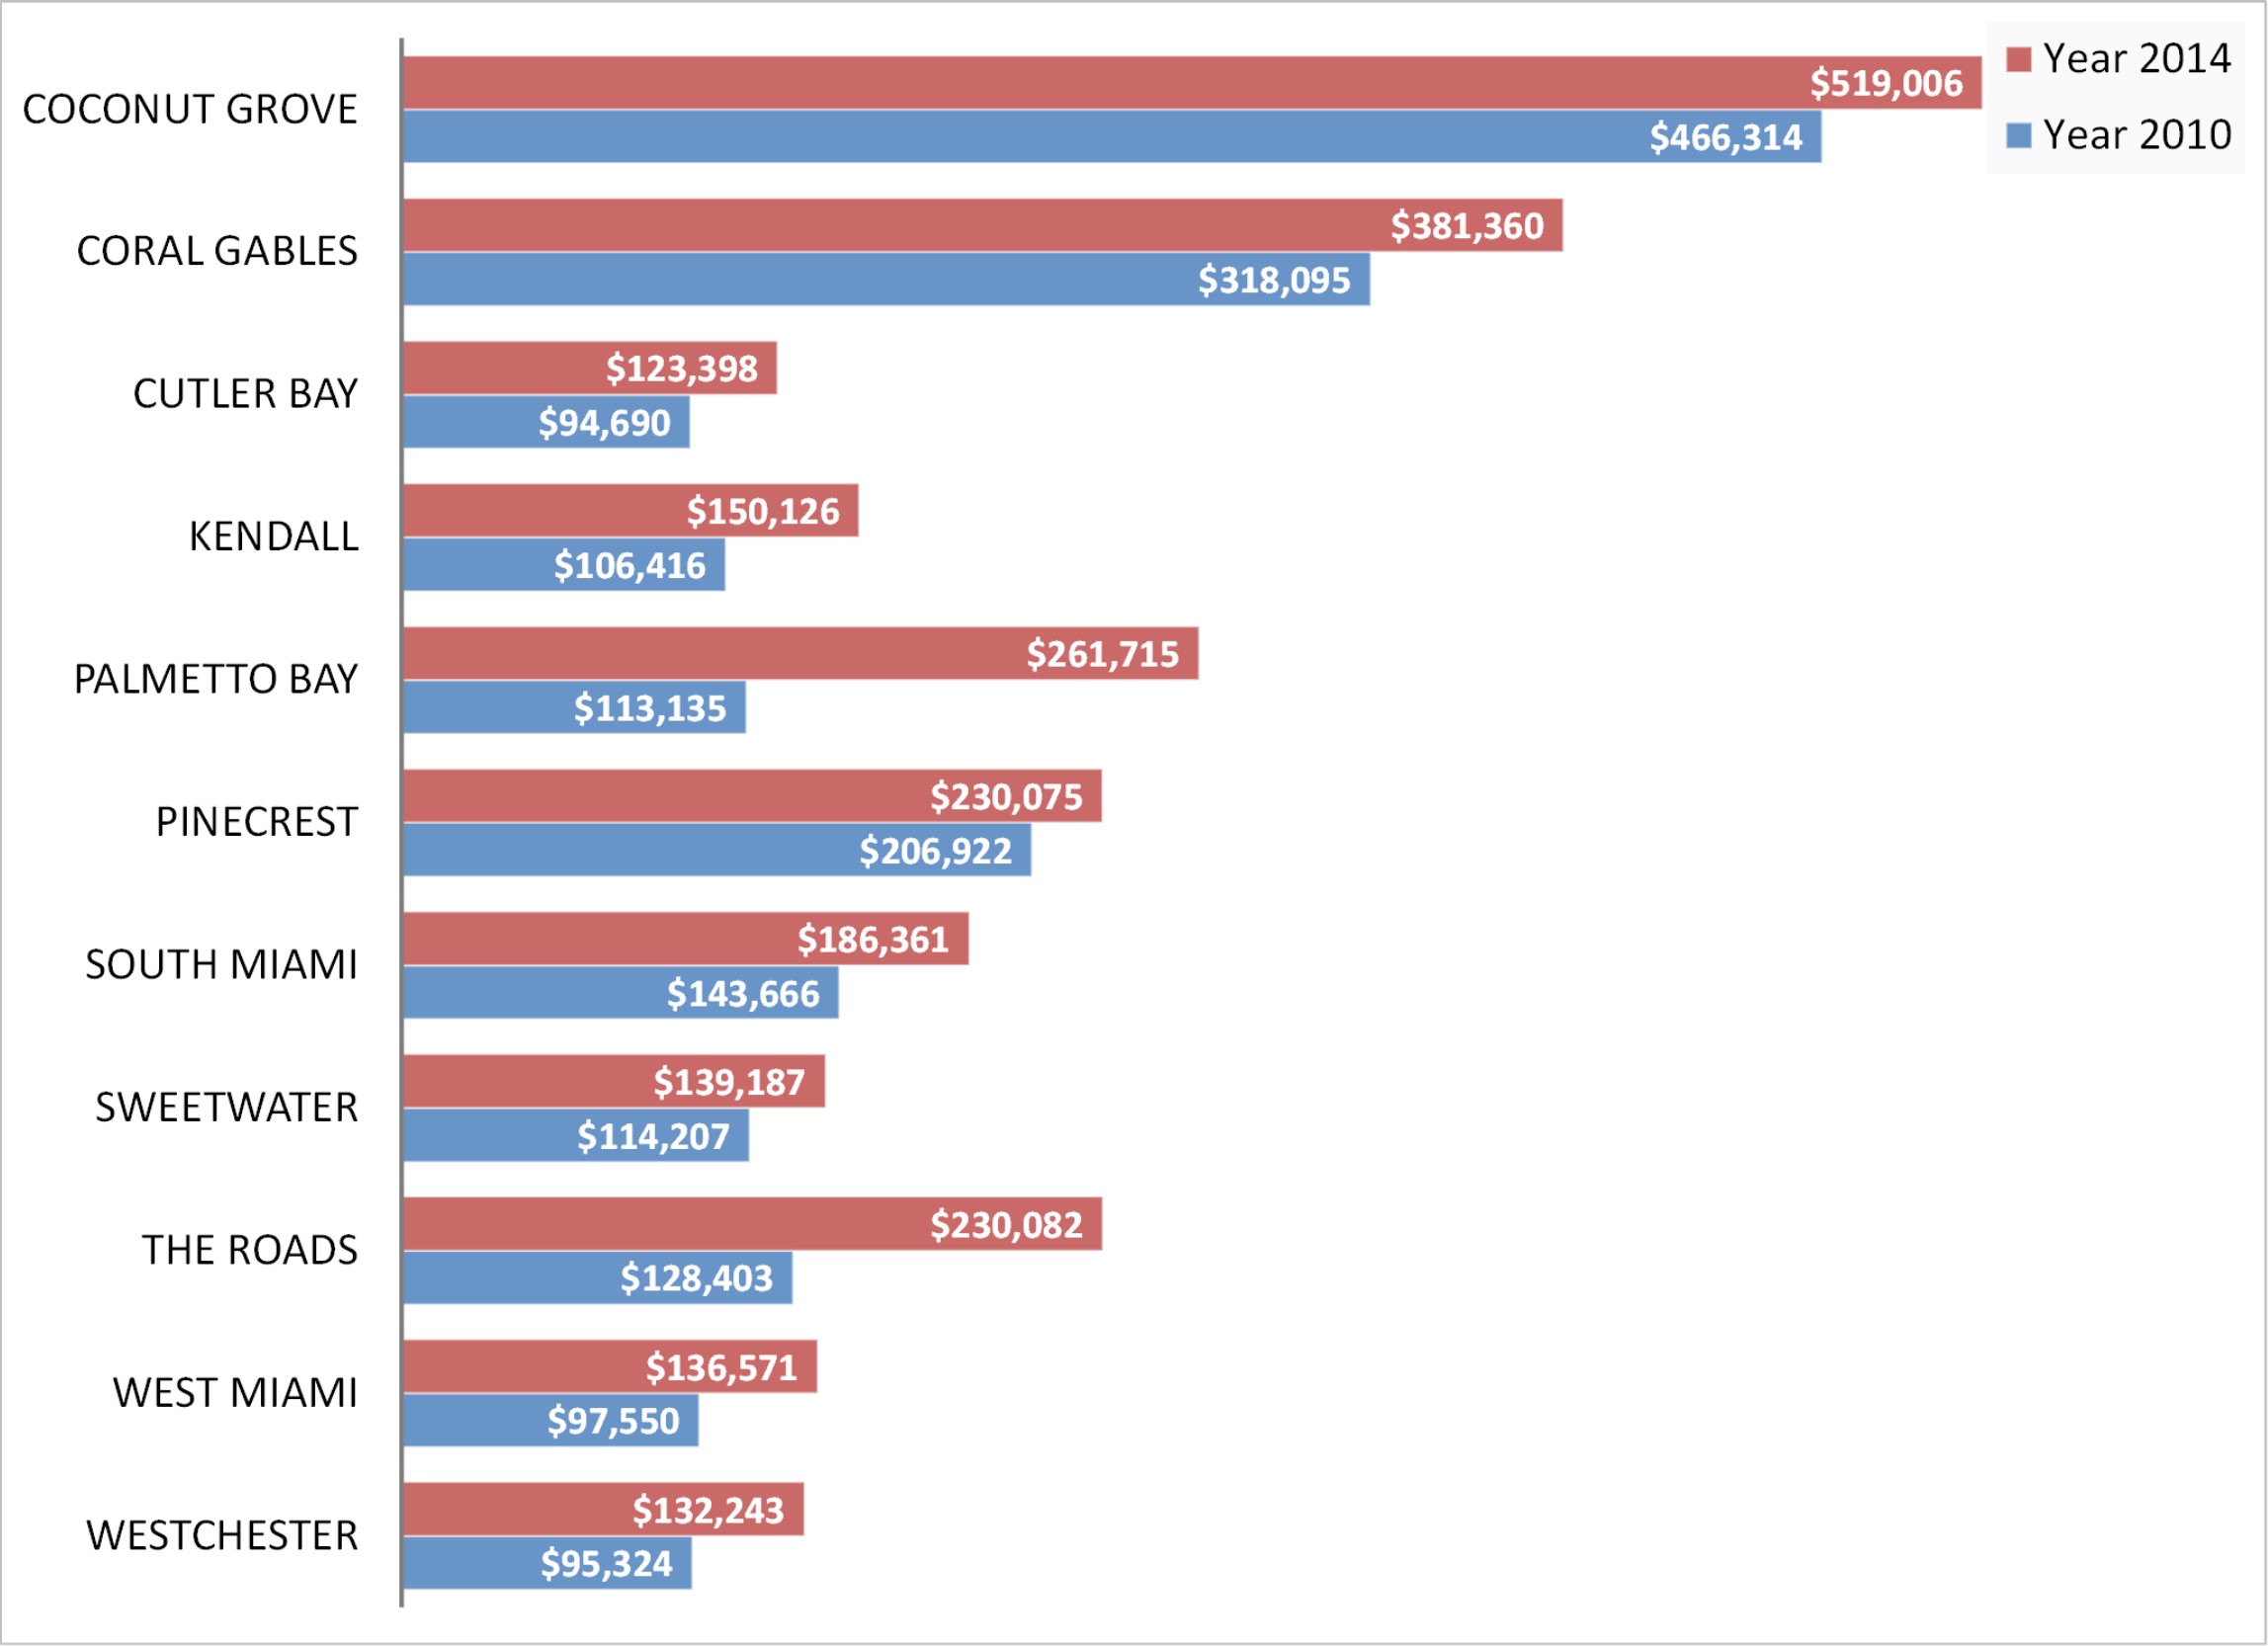
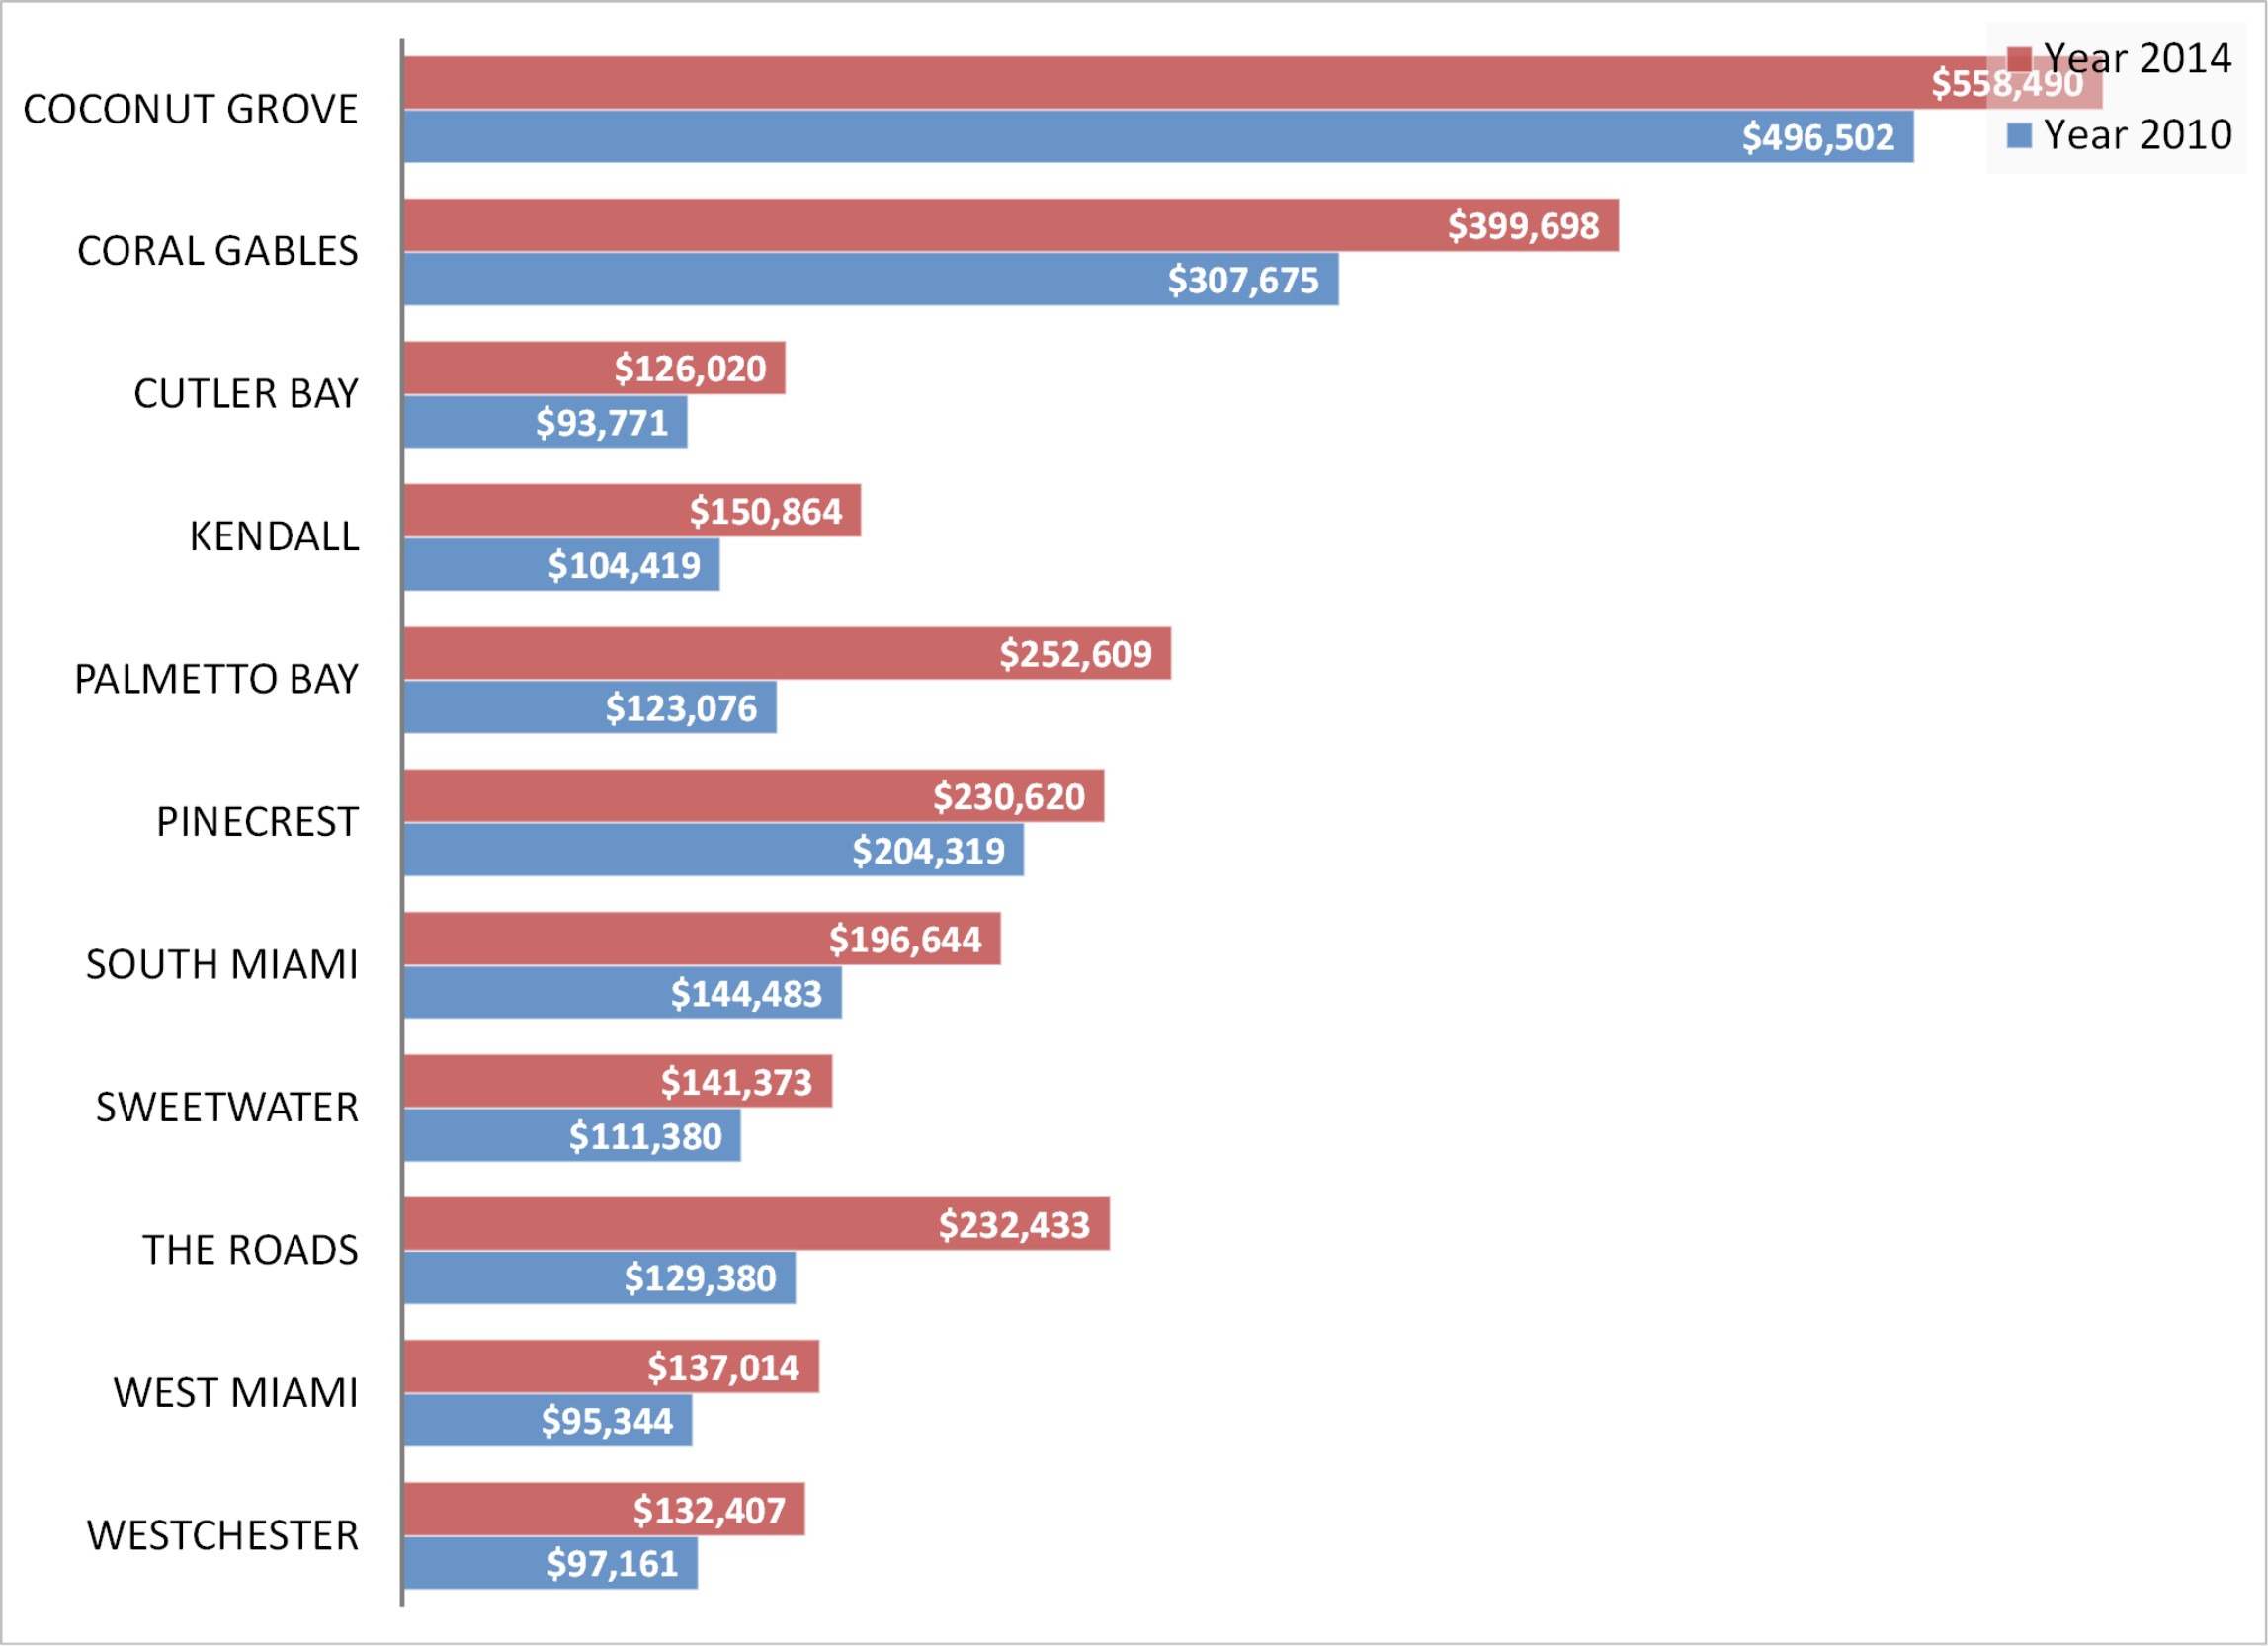
Average Home Price – Condo/Town Home – Year-to-date July 2010 vs Year-to-date July 2014 – Below graph details the comparison between the average home price in 2010 versus 2014 by city.

ave price th condo

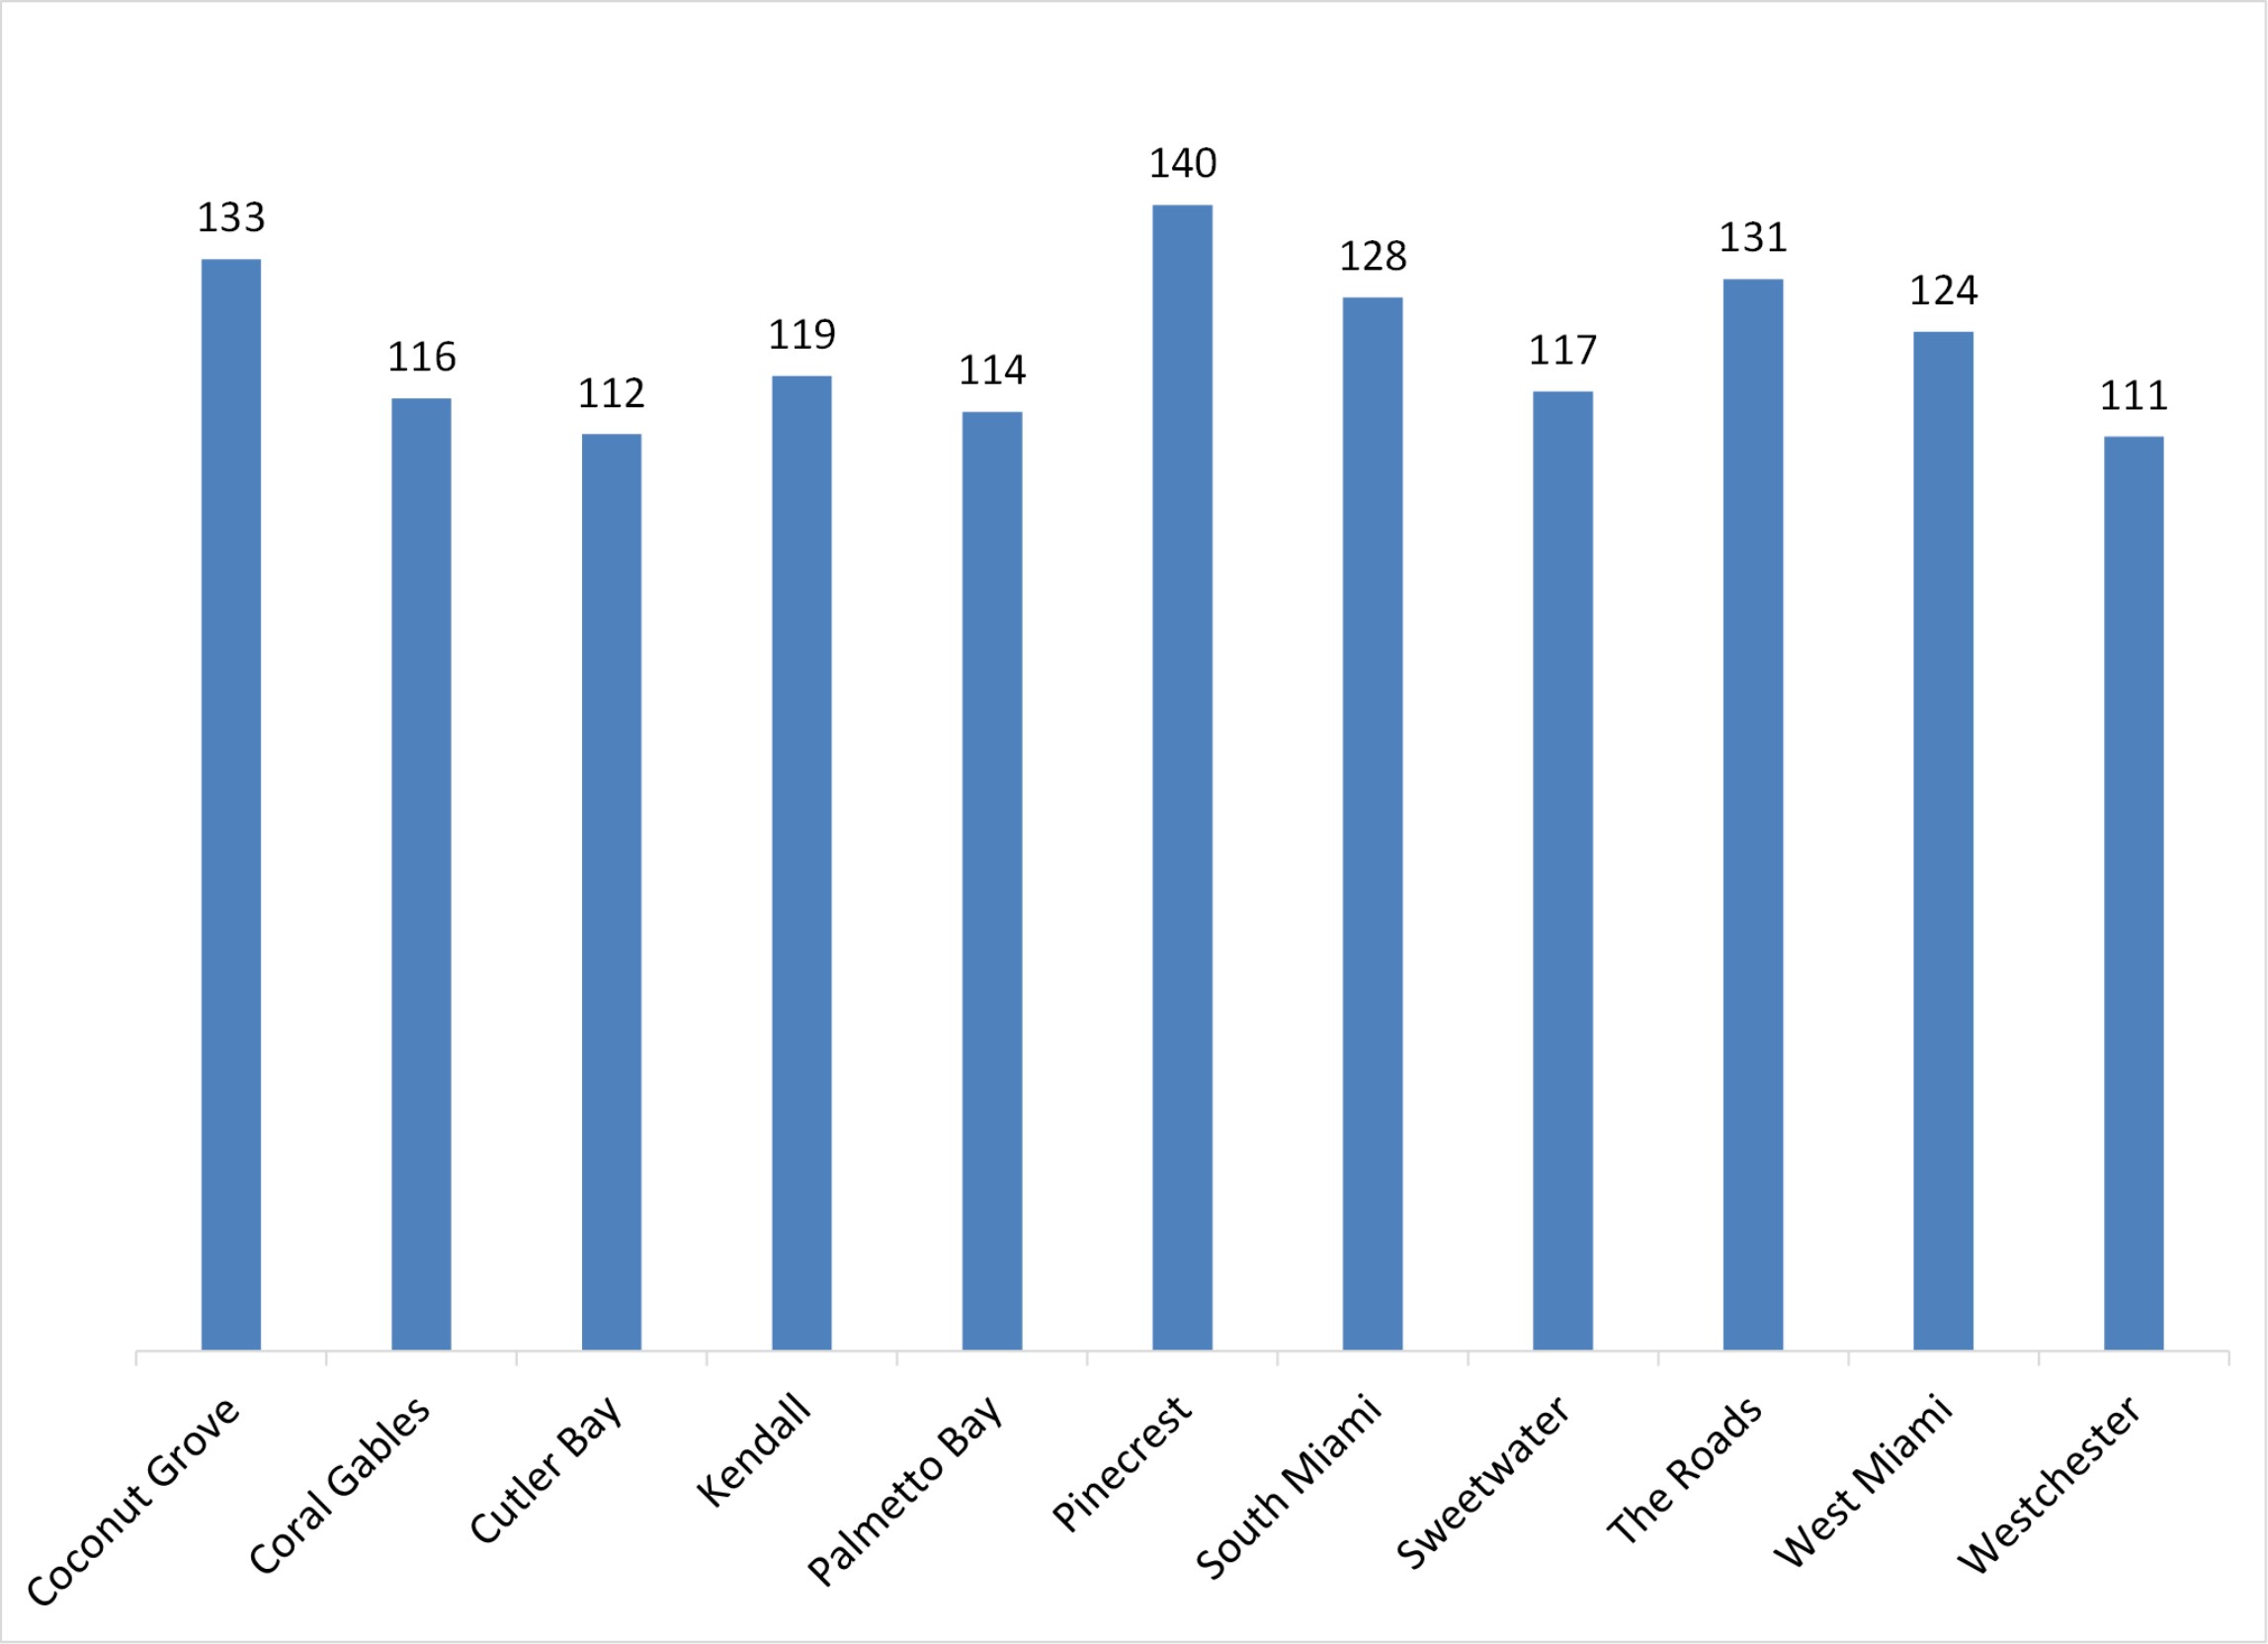
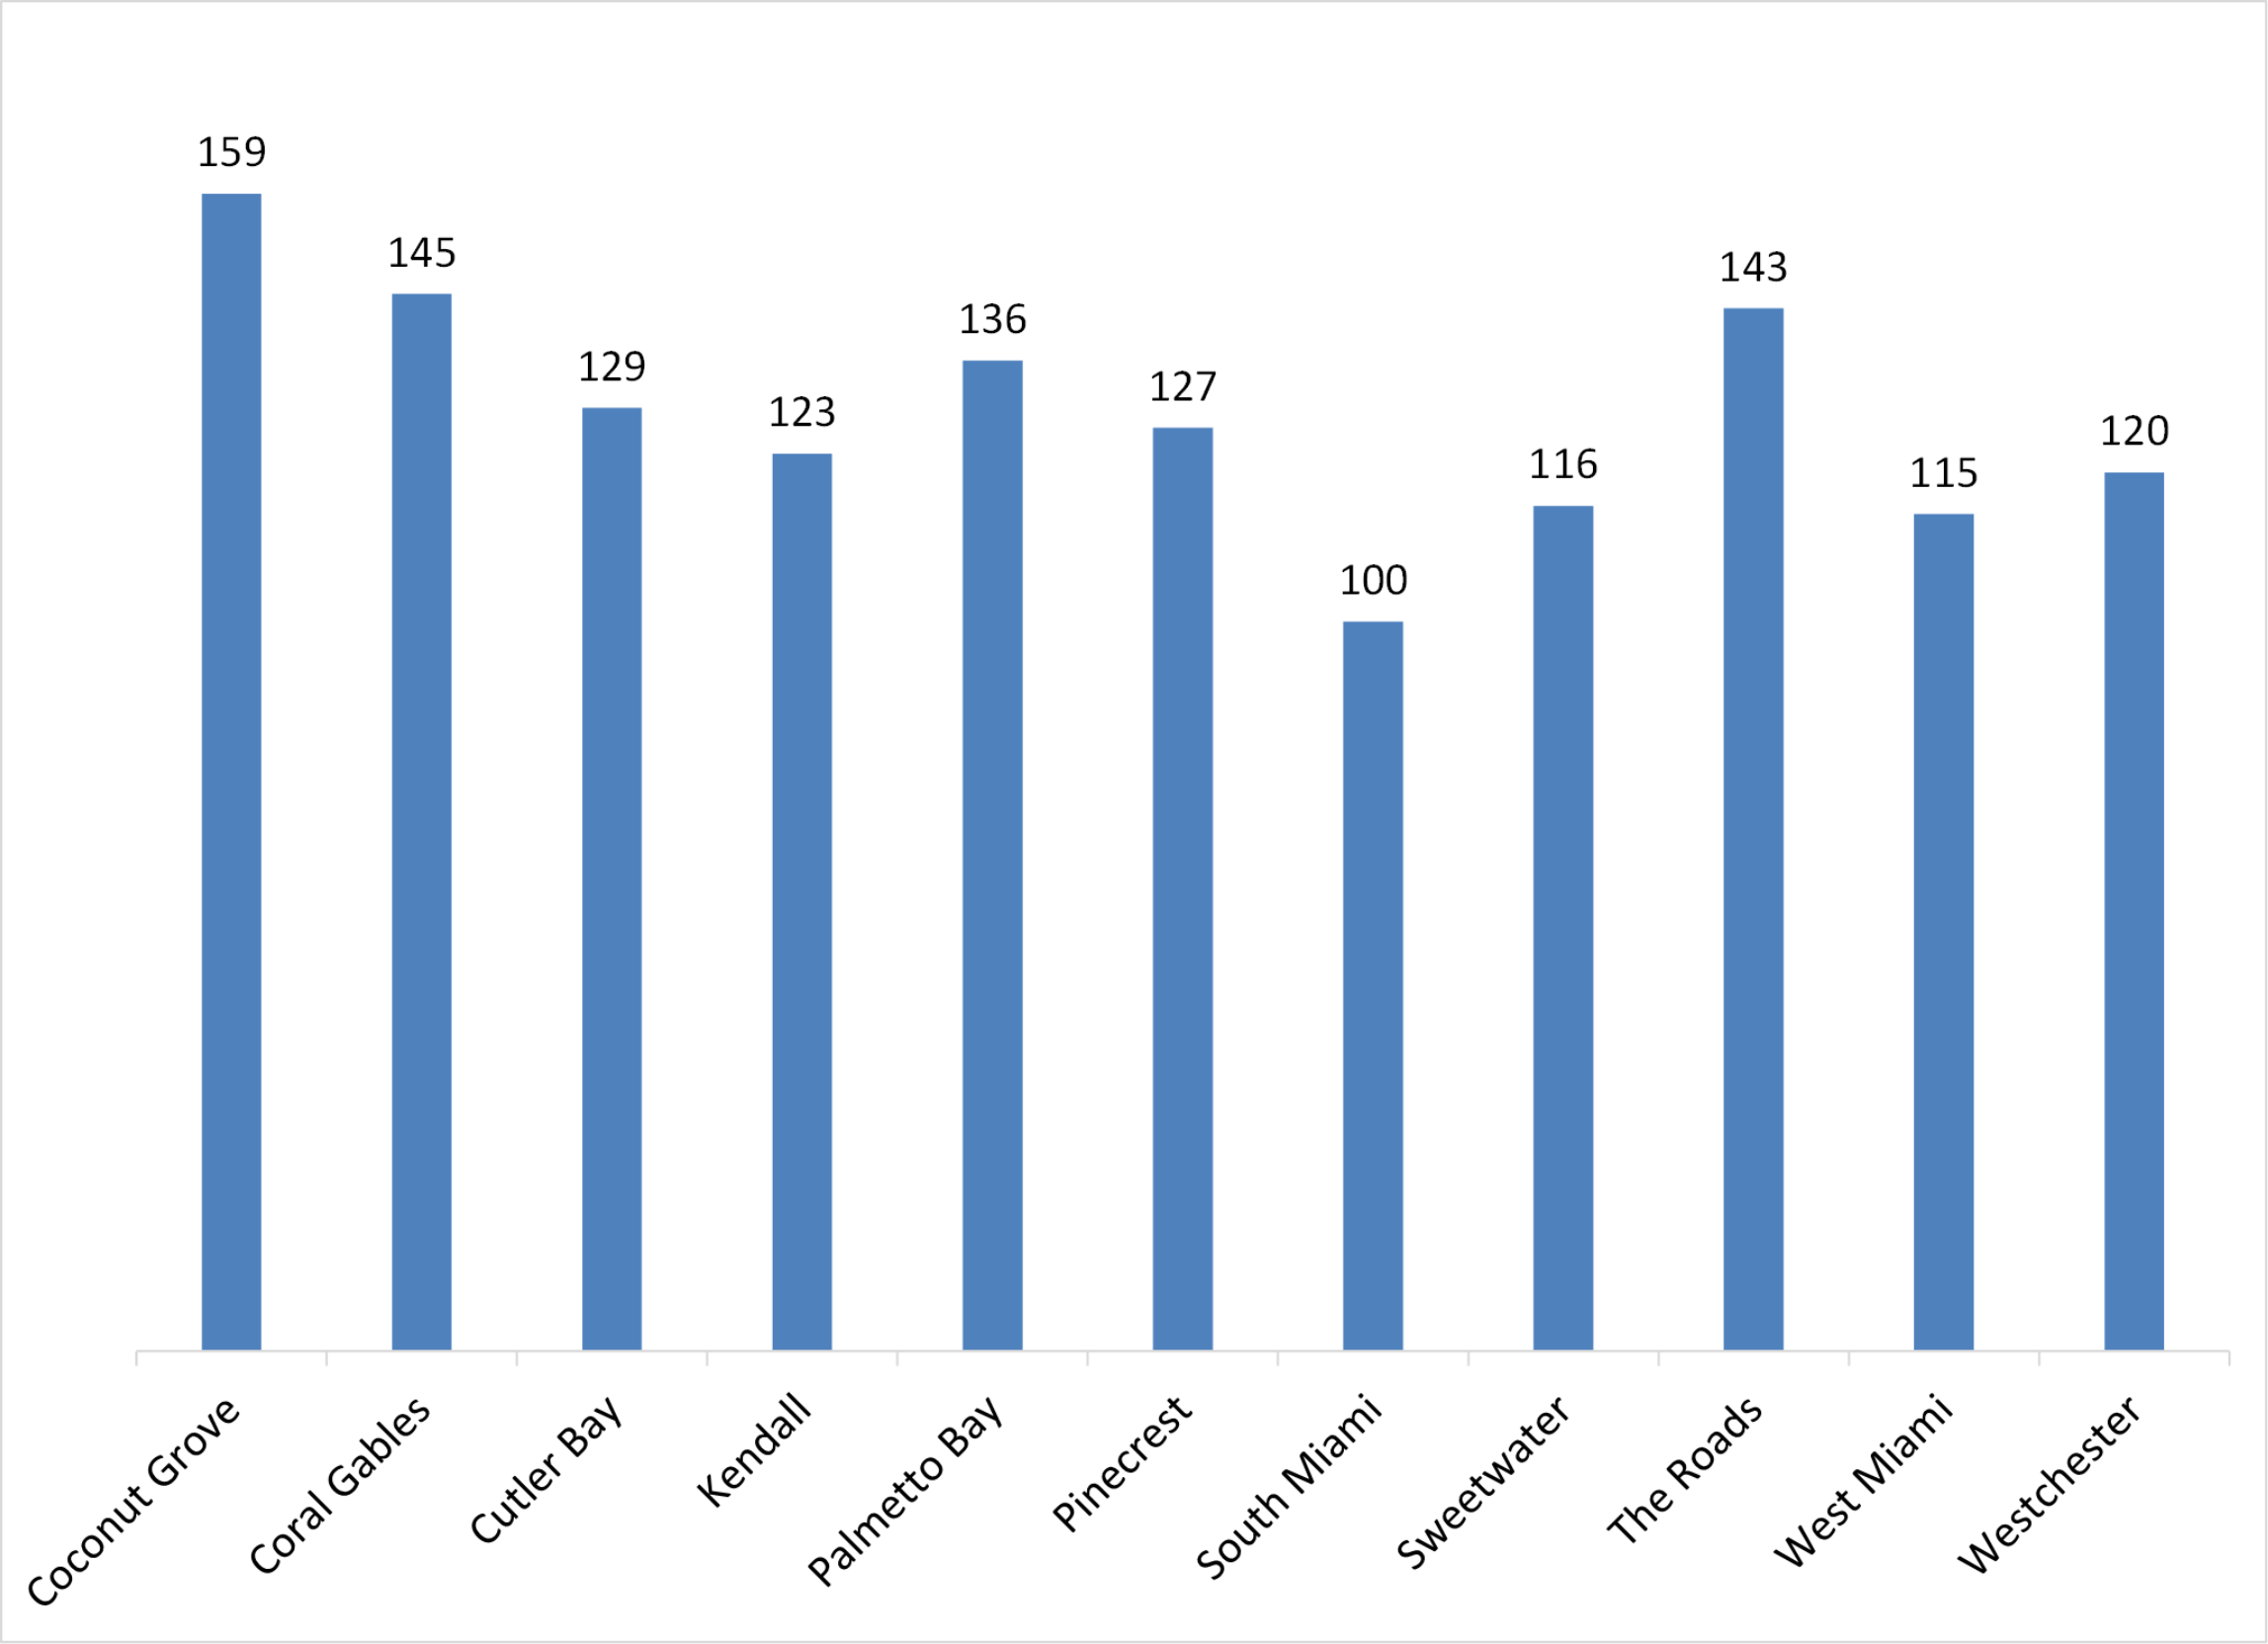
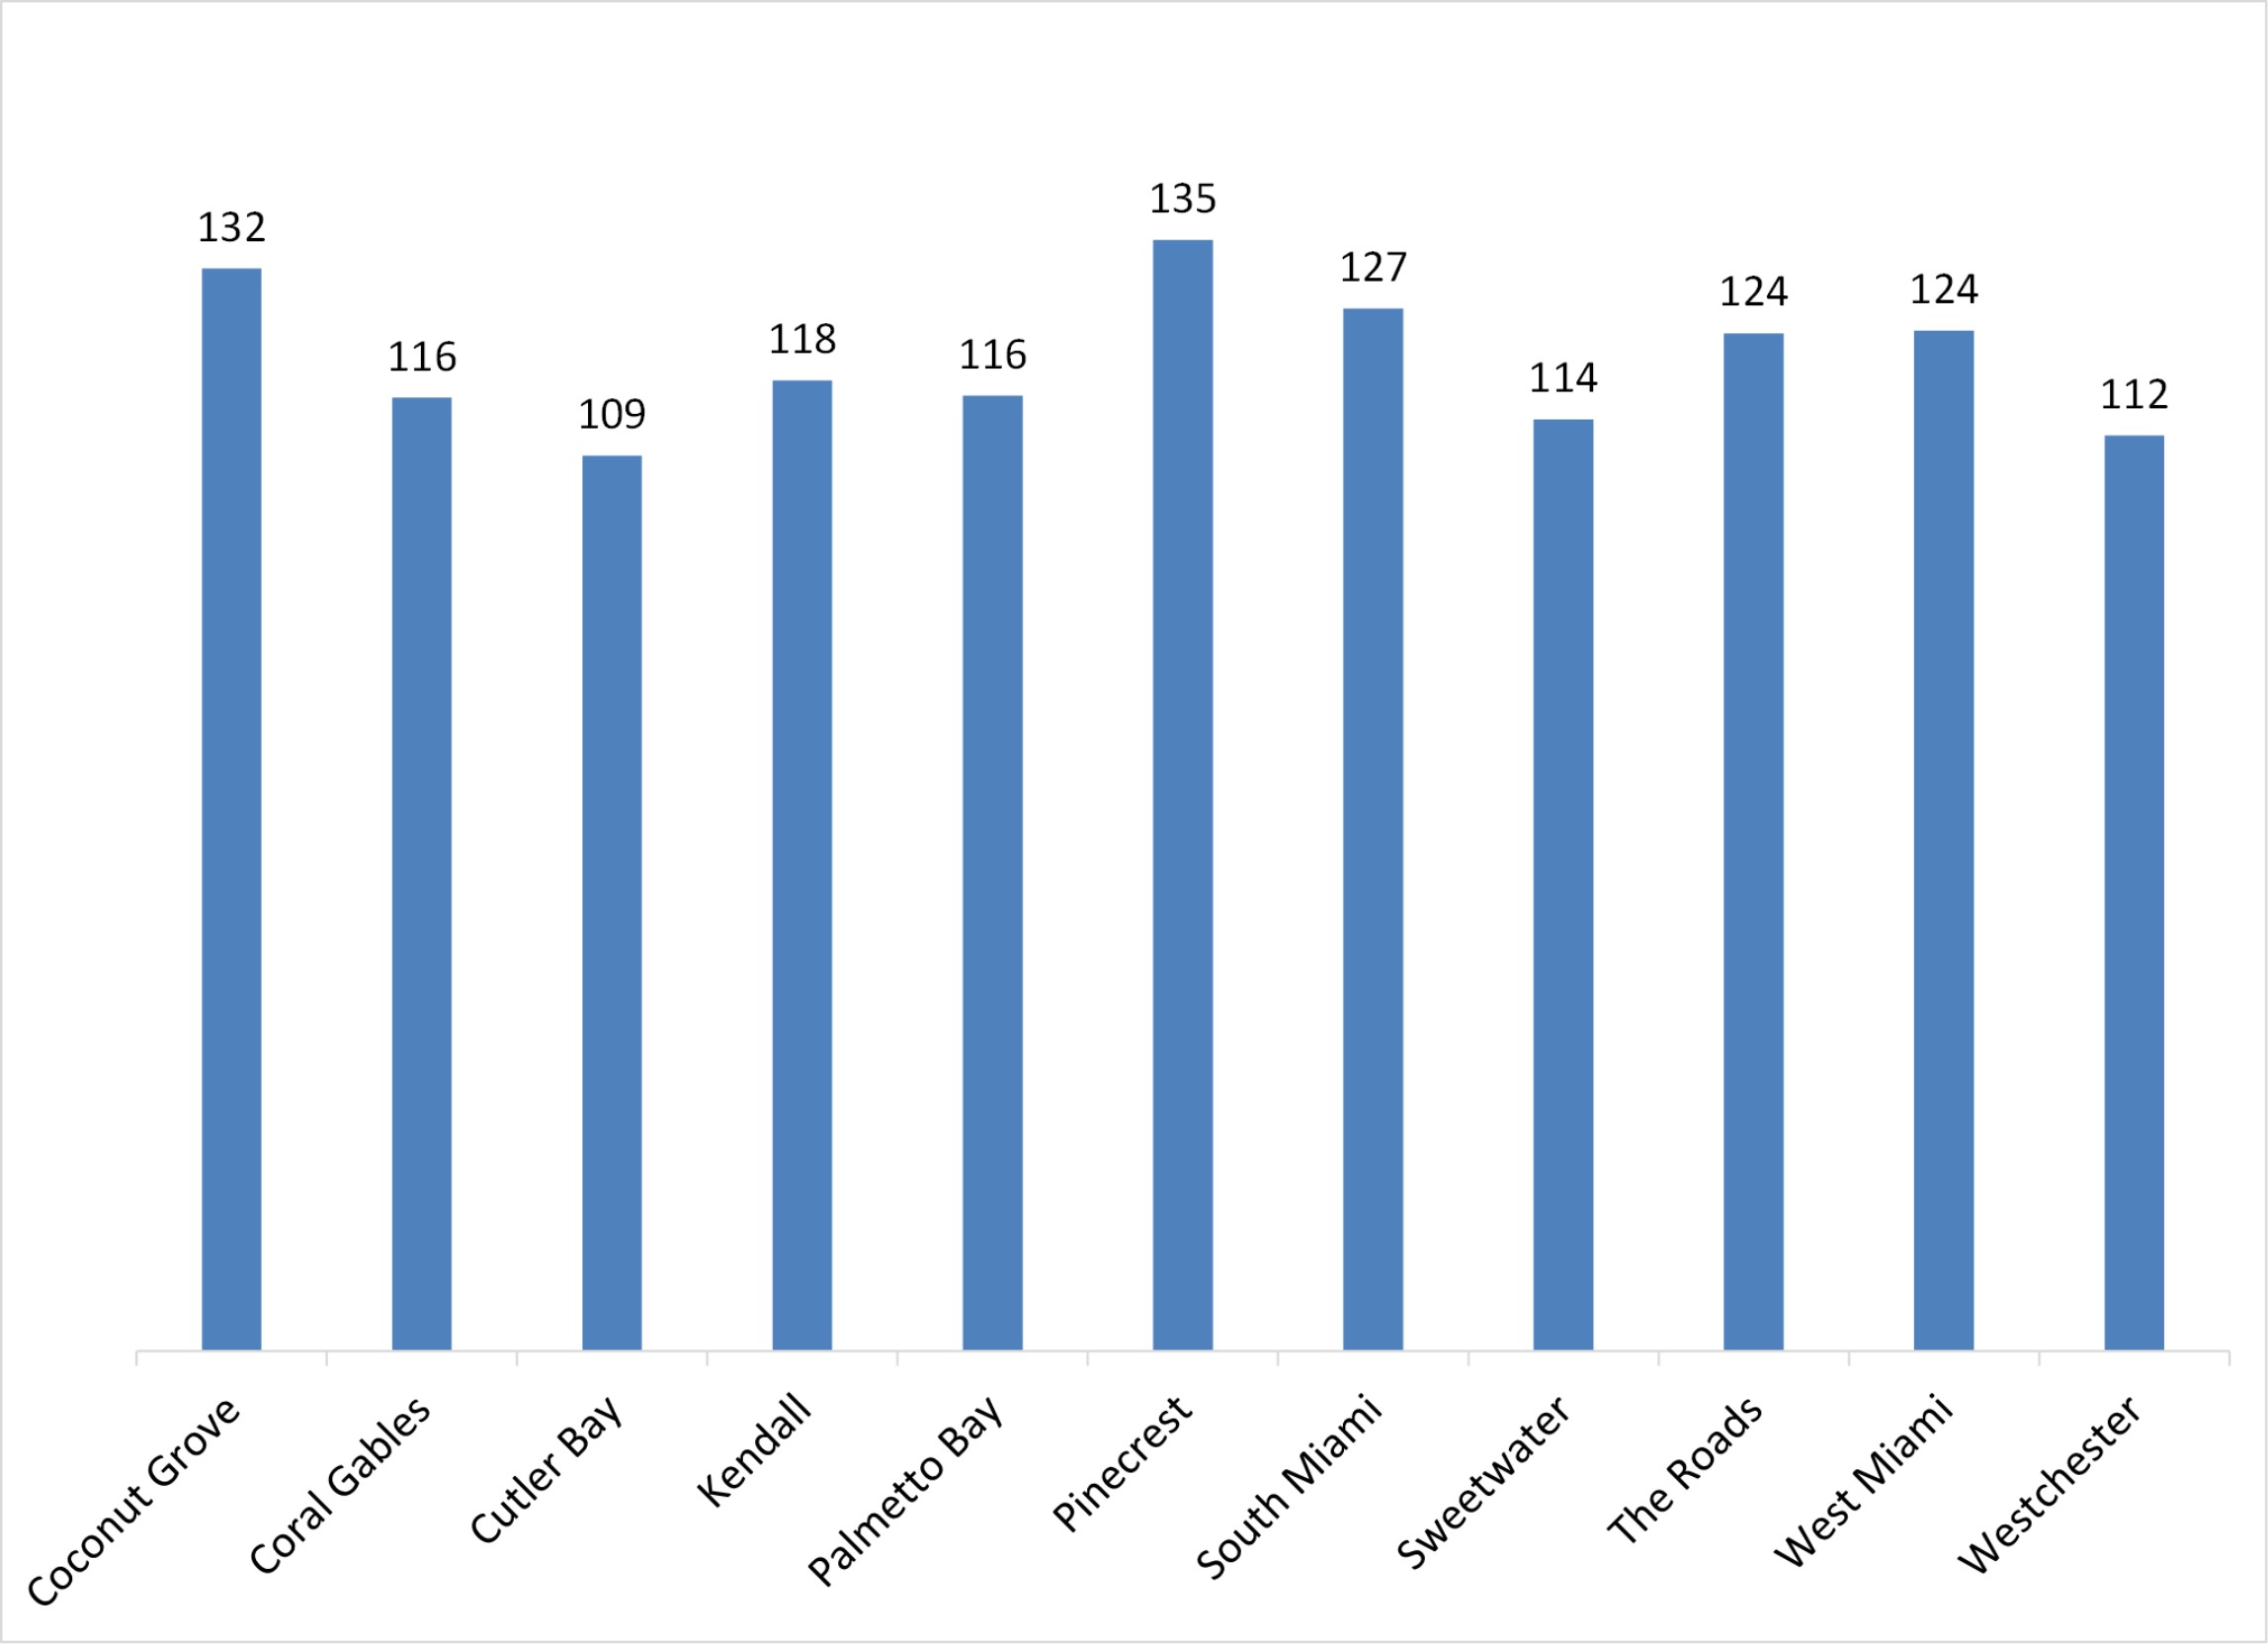
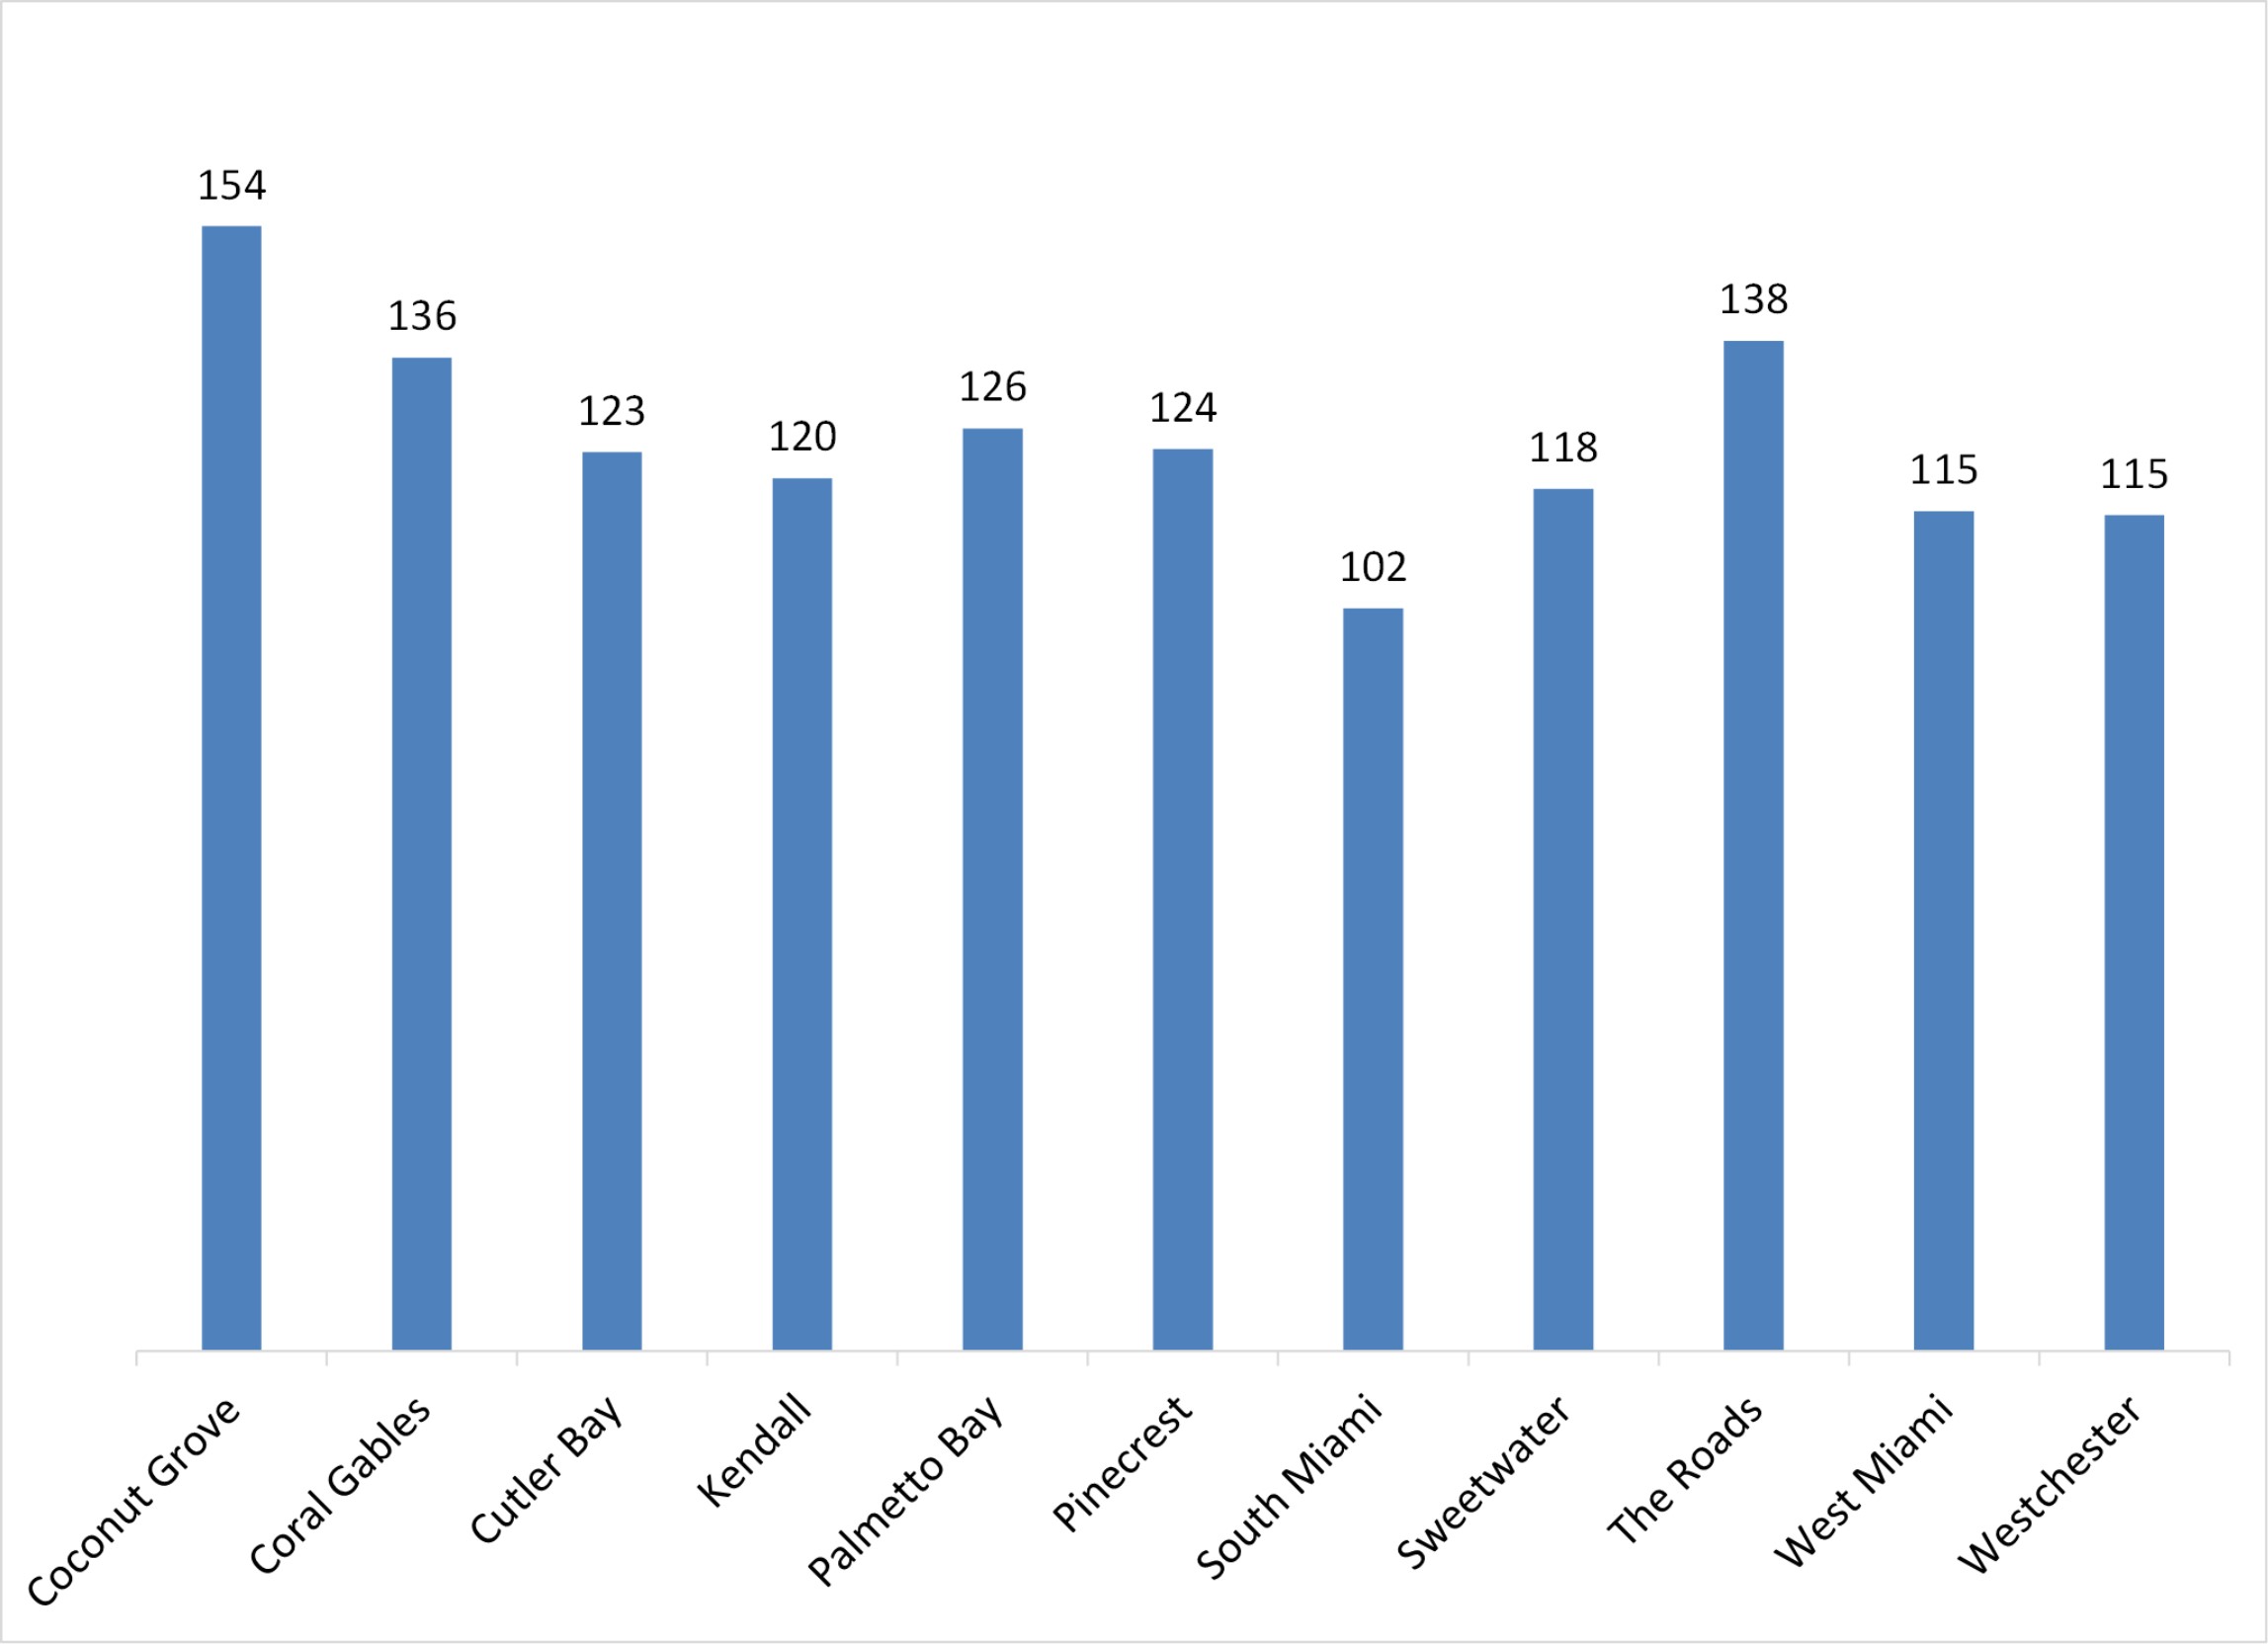
Days On Market or DOM – Single Family – Year-to-date July 2014 – The below chart shows the number of days a property stays in the market for sale until it is sold.

dom sfr

Days On Market or DOM – Condo/Town Home – Year-to-date July 2014 – The below chart shows the number of days a property stays in the market for sale until it is sold.

dom th condo

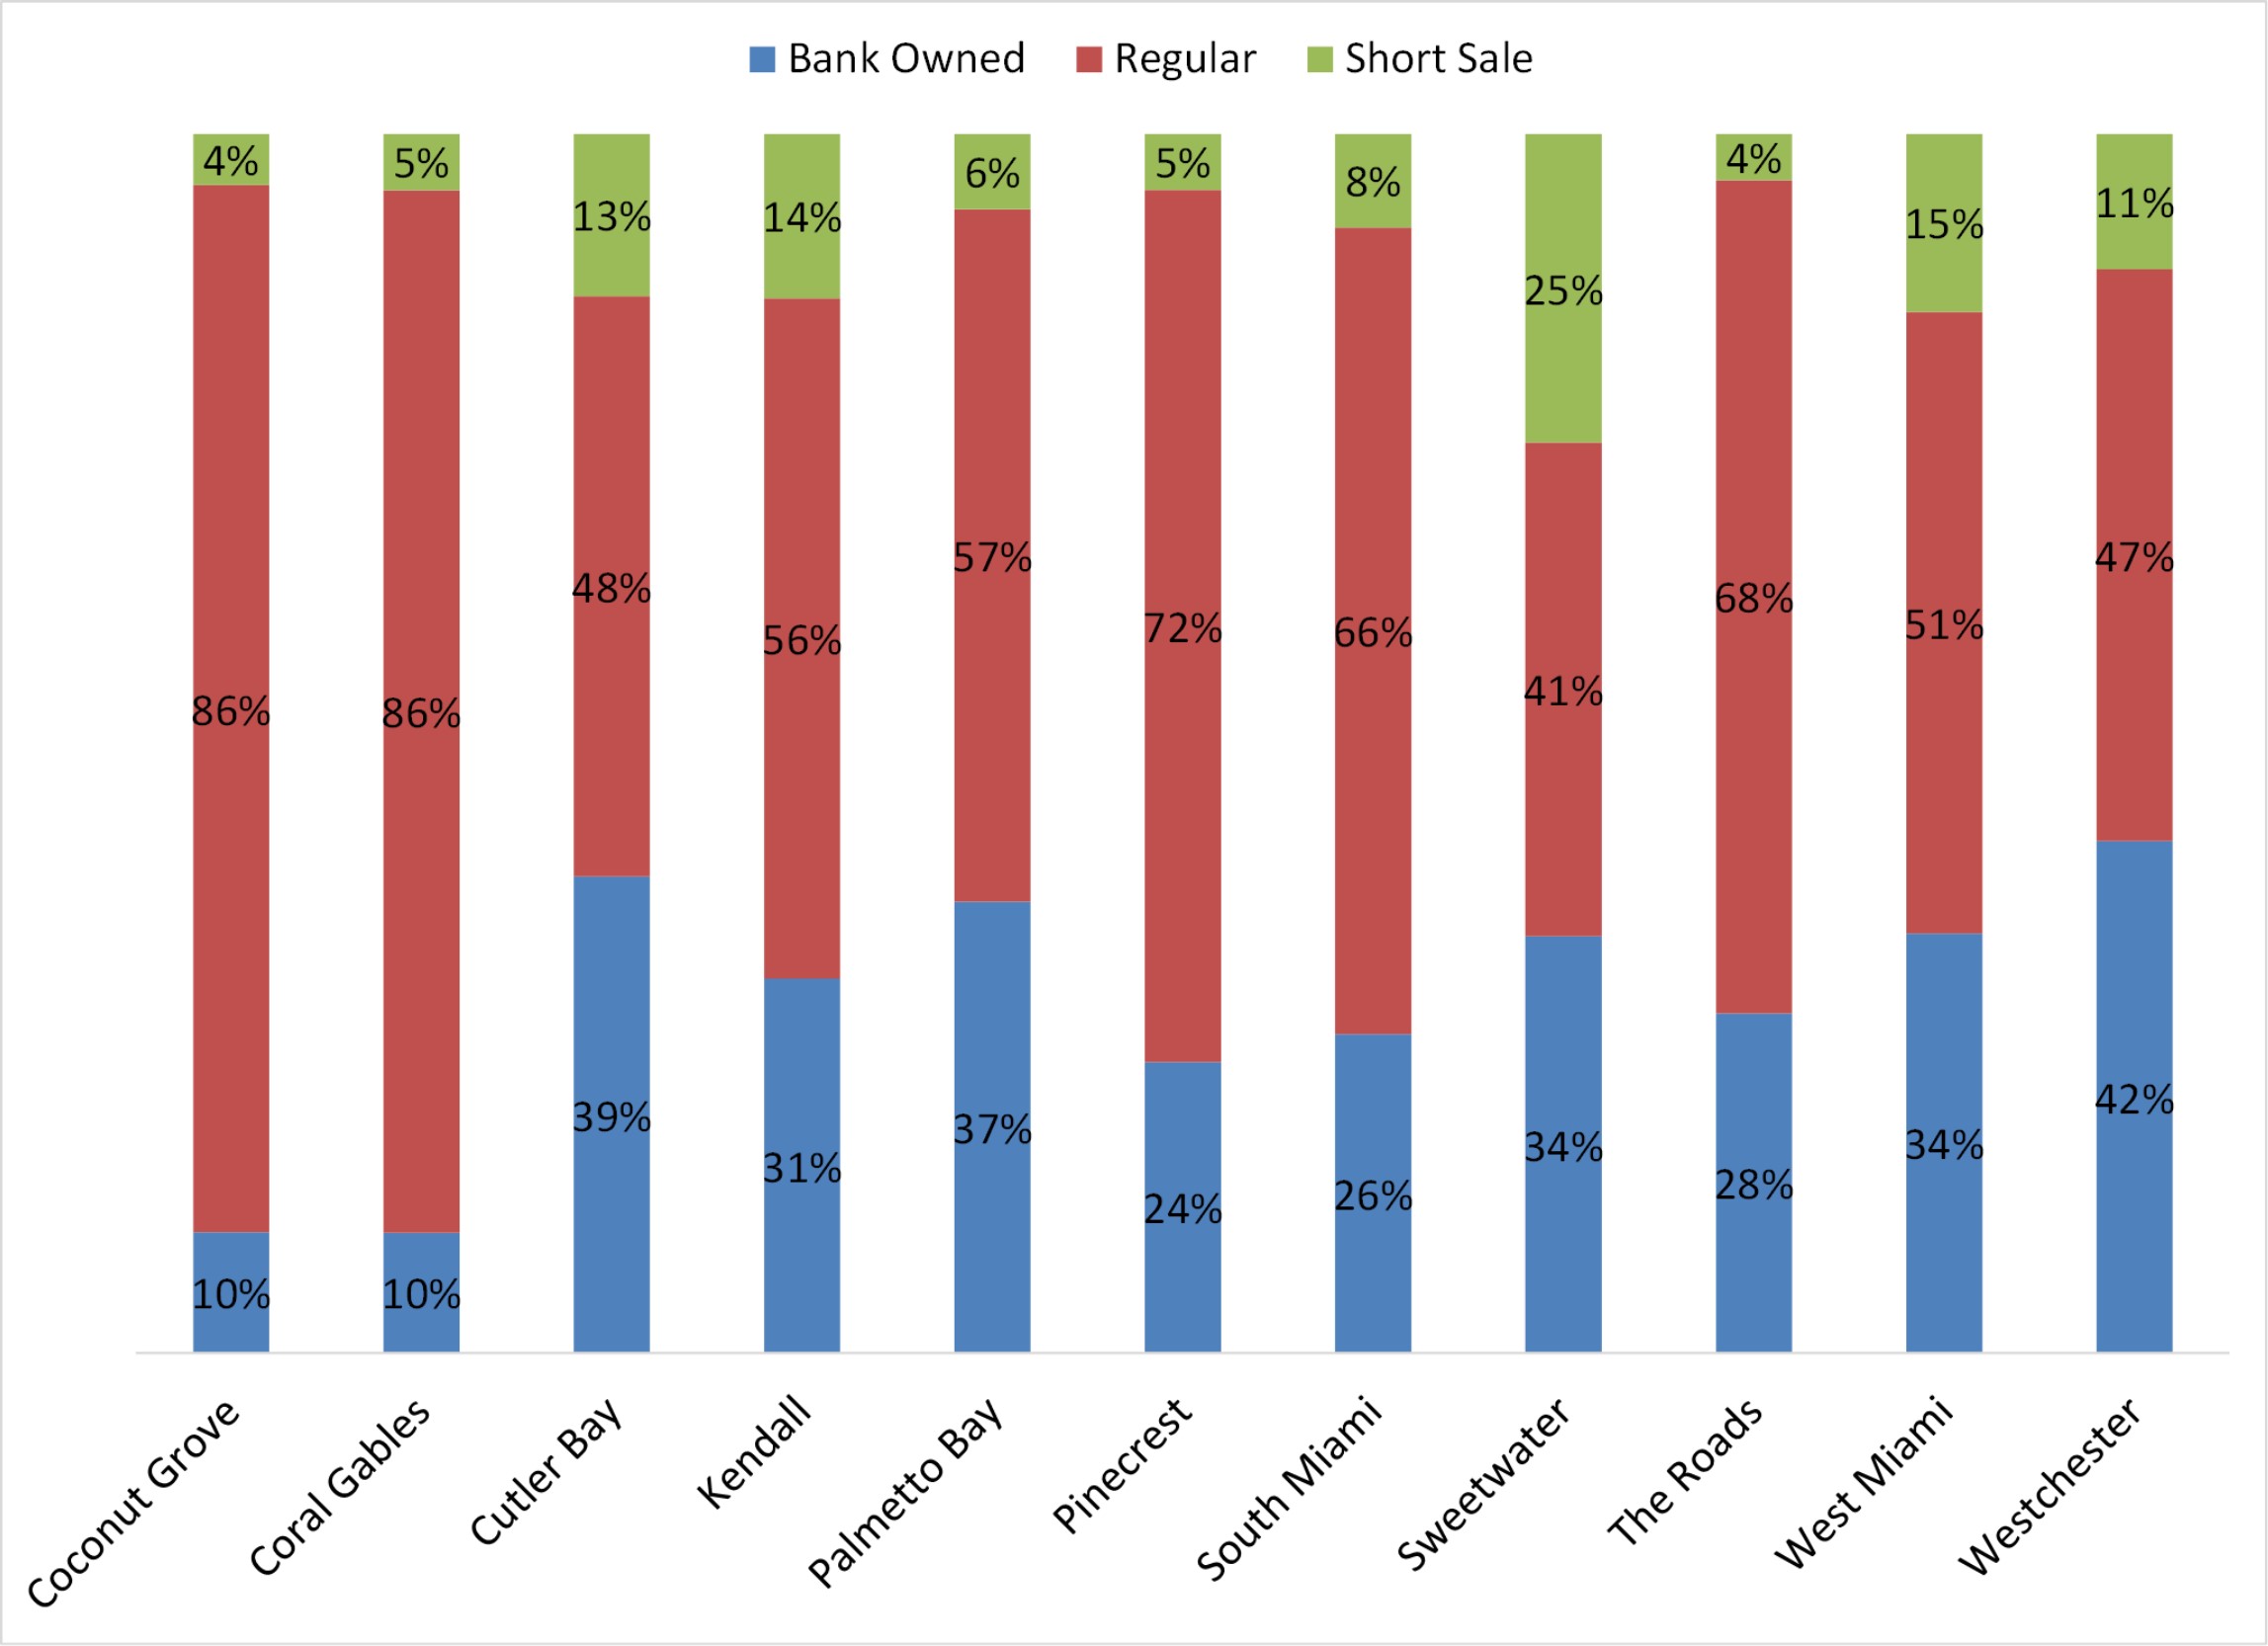
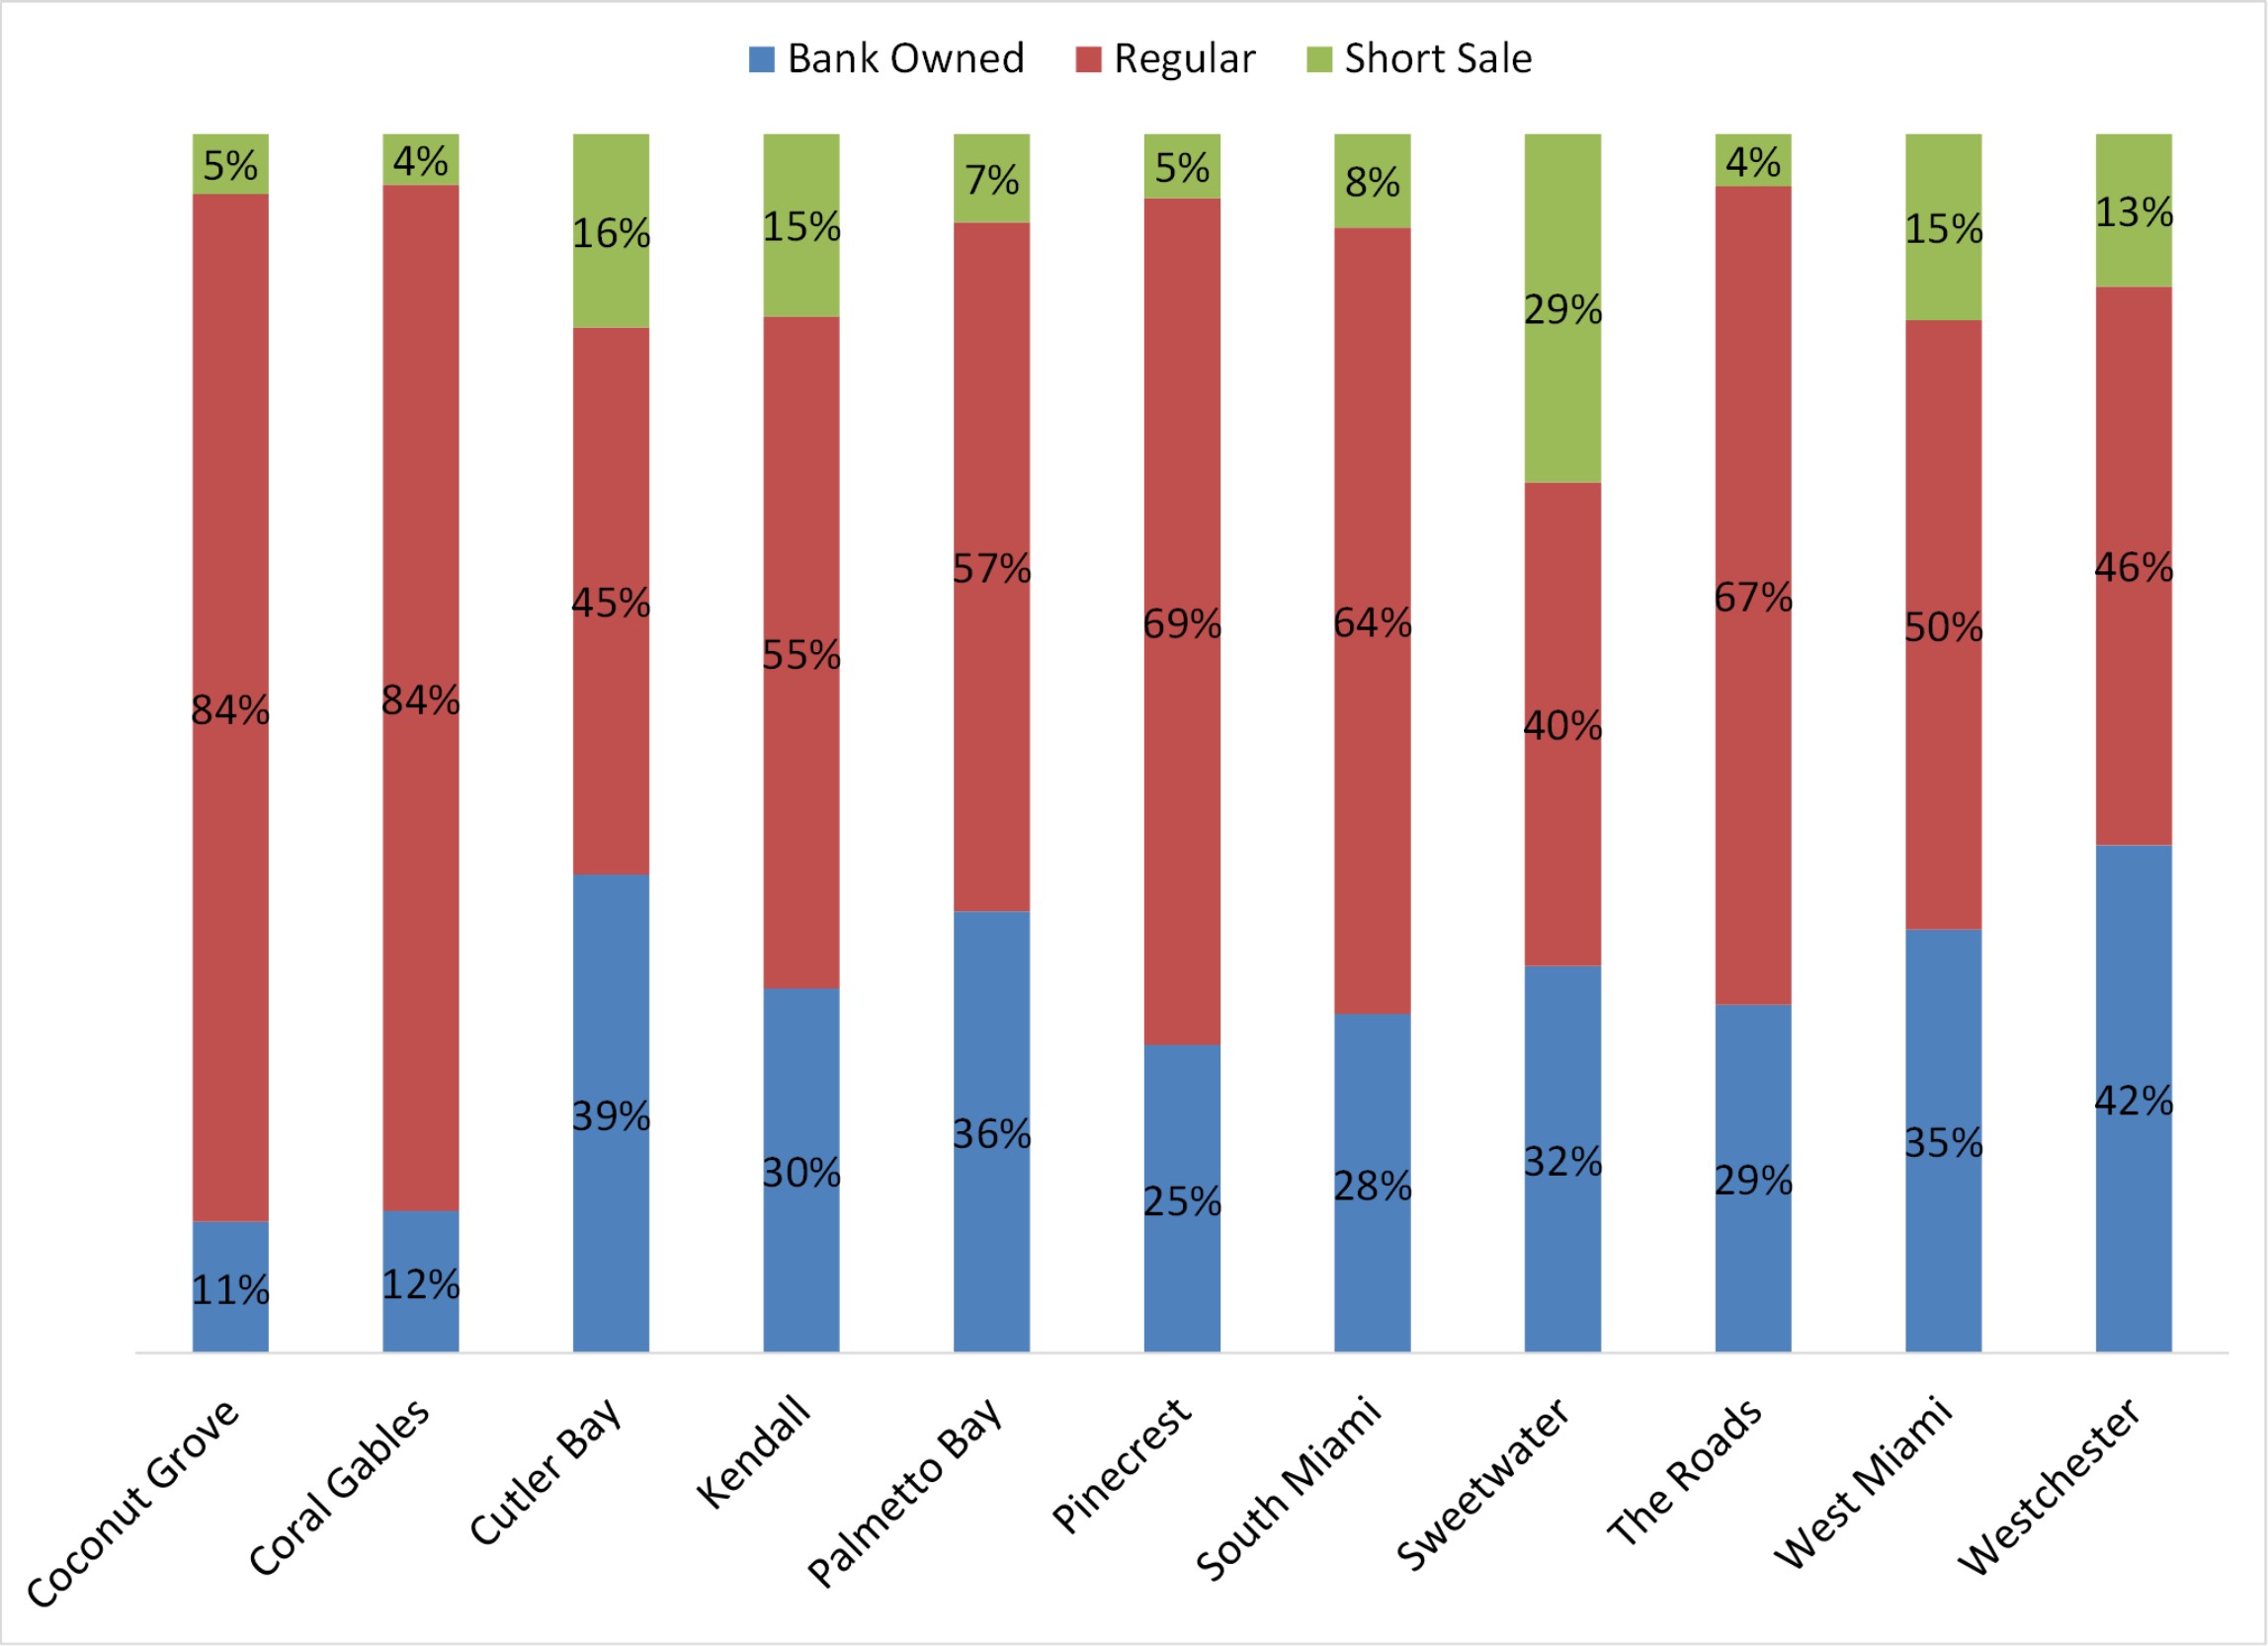
Transaction Type – Single Family – Year-to-date July 2014 – The below graph details the type of sales taking place by city.

type sfr

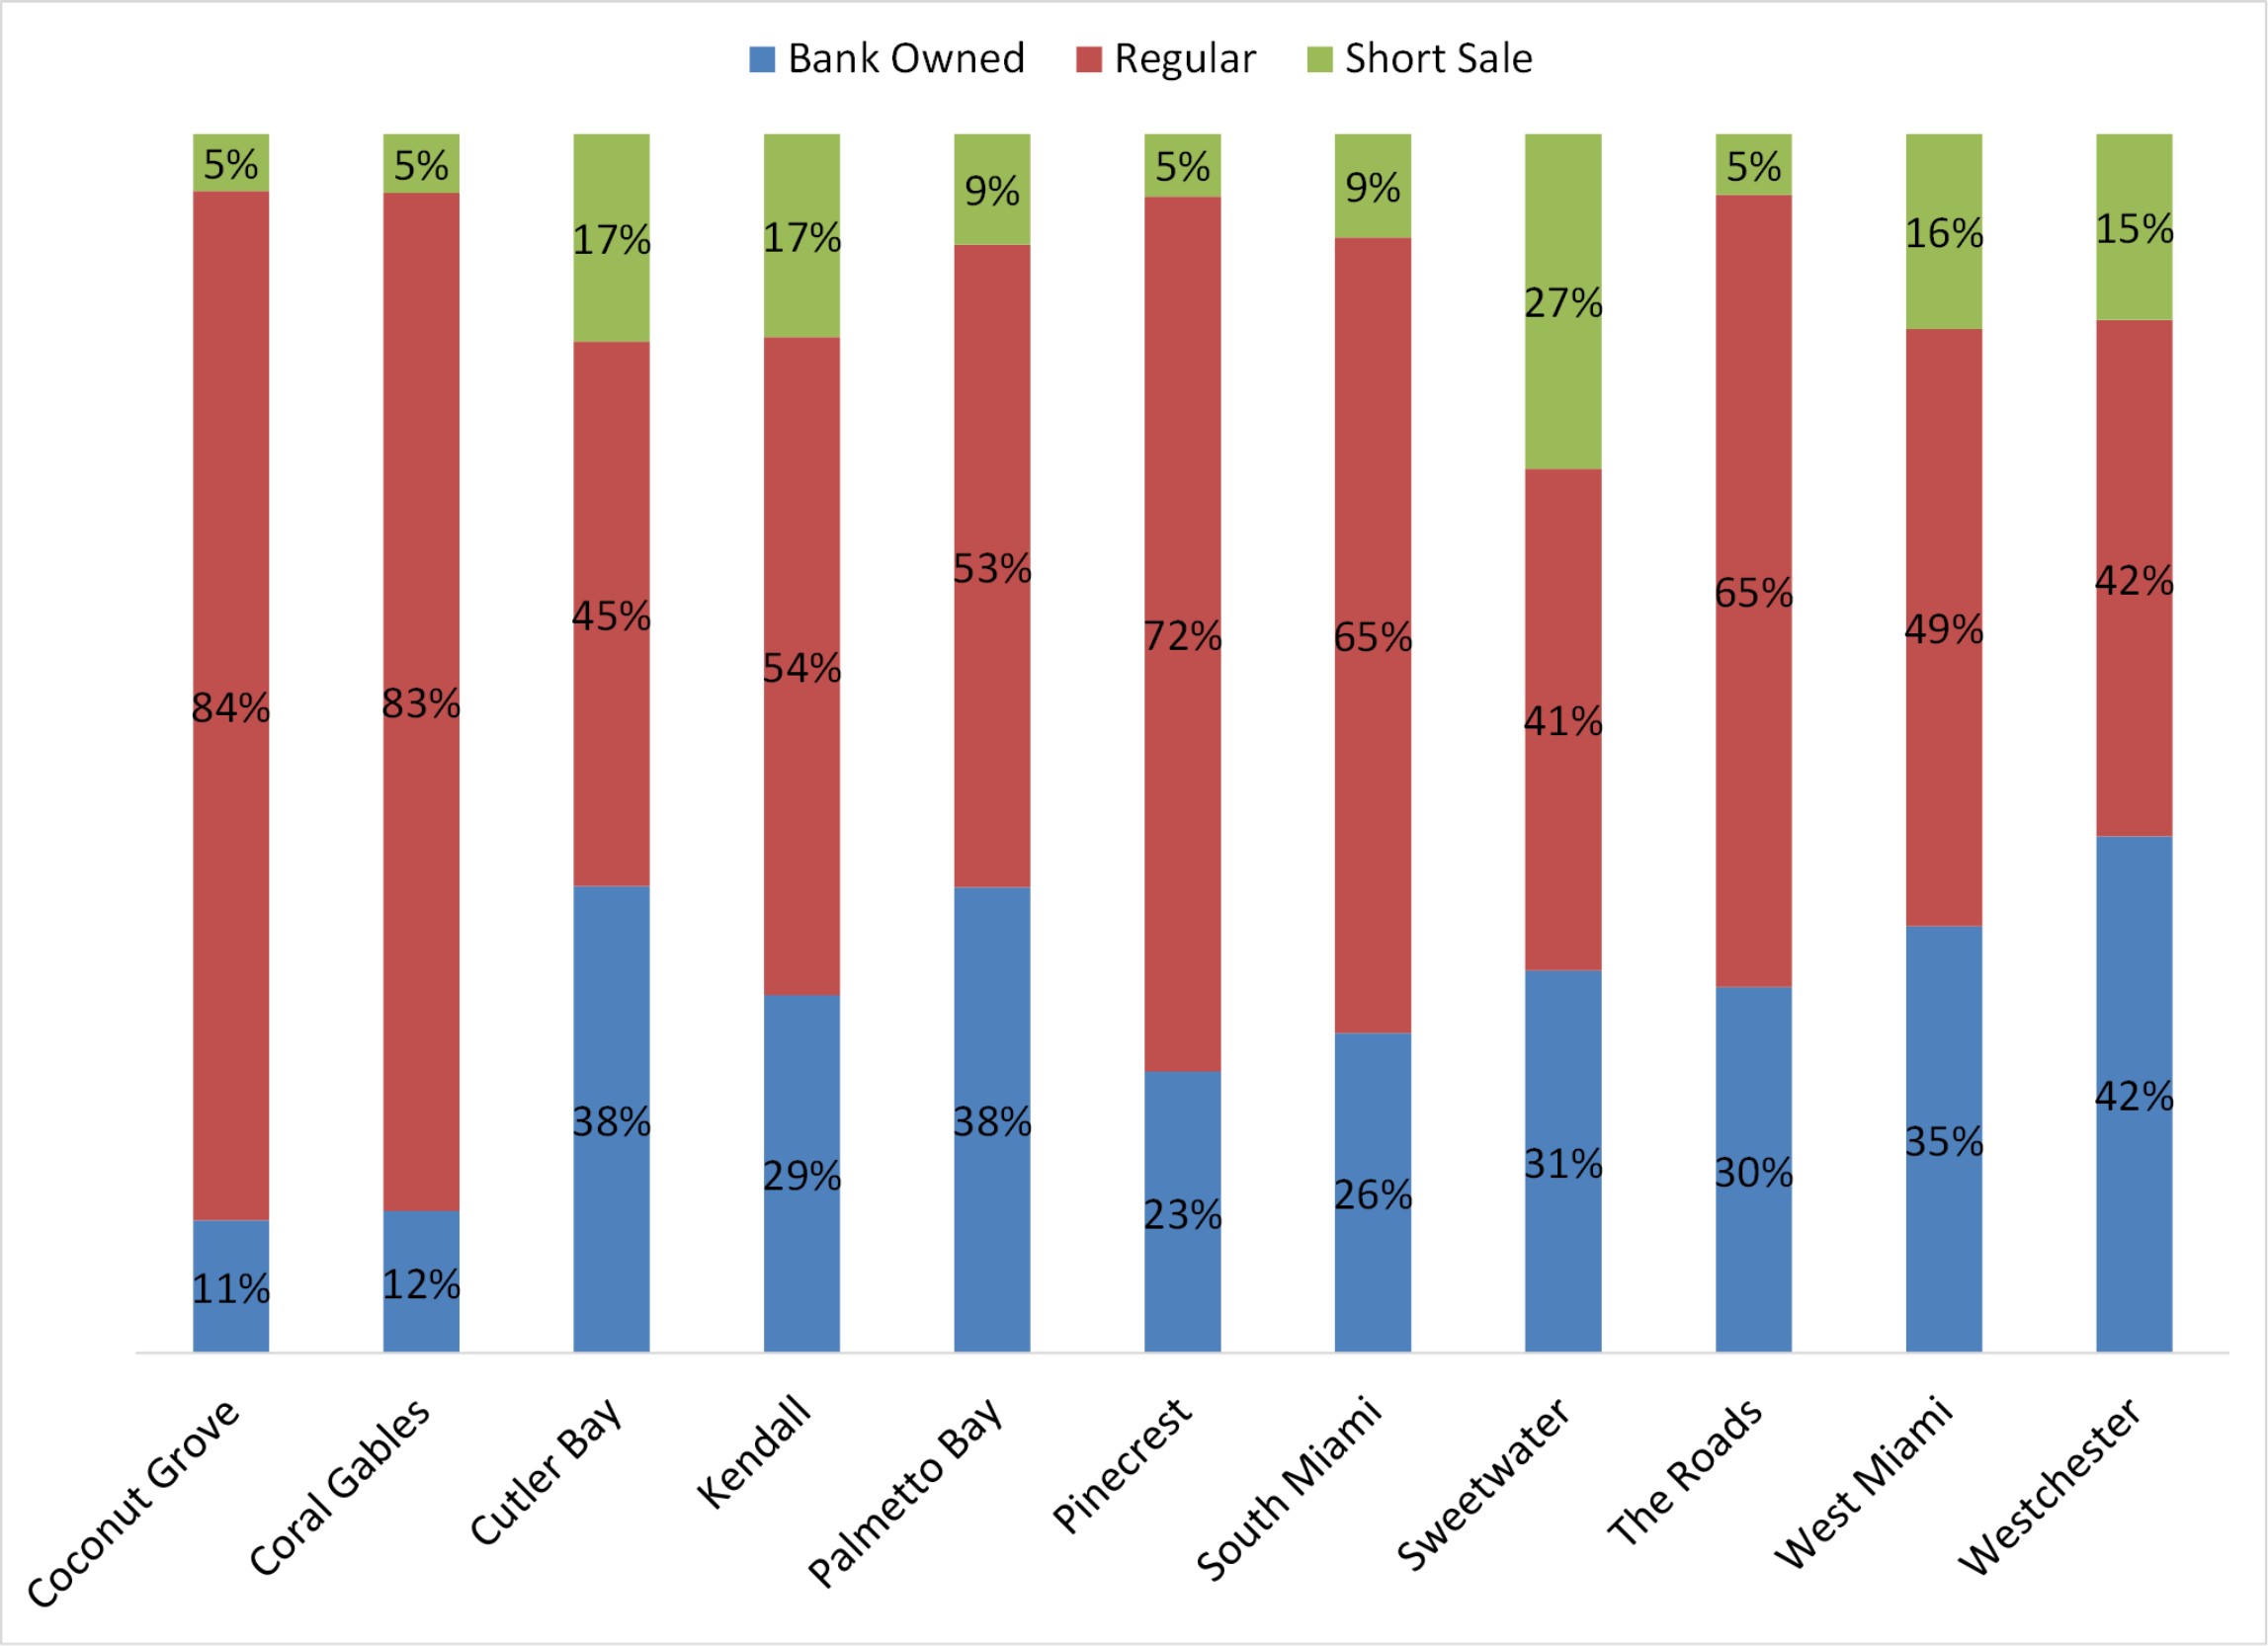
Transaction Type – Condo/Town Home – Year-to-date July 2014 – The below graph details the type of sales taking place by city.

type th condo

Three To Four Months To Sell Your Home


Average Home Price – Single Family – Year-to-date June 2010 vs Year-to-date June 2014 – Below graph details the comparison between the average home price in 2010 versus 2014 by city.

average single family price miami

Average Home Price – Condo/Town Home – Year-to-date June 2010 vs Year-to-date June 2014 – Below graph details the comparison between the average home price in 2010 versus 2014 by city.

average condo townhouse price miami

Days On Market or DOM – Single Family – Year-to-date June 2014 – The below chart shows the number of days a property stays in the market for sale until it is sold.

days on market single family home miami

Days On Market or DOM – Condo/Town Home – Year-to-date June 2014 – The below chart shows the number of days a property stays in the market for sale until it is sold.

days on market condo townhouse miami

Transaction Type – Single Family – Year-to-date June 2014 – The below graph details the type of sales taking place by city.

type of single family home sale in miami

Transaction Type – Condo/Town Home – Year-to-date June 2014 – The below graph details the type of sales taking place by city.

type of condo townhouse sale in miami

5631 SW 67 Ave South Miami FL $355,000 (SOLD)

This slideshow requires JavaScript.

Conventional or cash only. Updated single family home in the heart of South Miami. New roof. New plumbing. New electricity. New windows. New AC.  Brilliant-shined terrazzo flooring. Extra-large lot with extra-large shed and fitting for Olympic size pool. Open living-dining room layout.  Spacious kitchen with plenty of cabinetry overseeing large breakfast area. Wood flooring in master bedroom with double closets and contemporary-styled bathroom. Septic tank.

Virtual Tour


Property Details:

  • Transaction Type: Seller Representation
  • Address: 5631 SW 67 Ave
  • City, State and Zip: South Miami, FL 33143
  • Asking Price for sale/ rent: $355,000/ $2,400
  • Short sale or foreclosure: no / no
  • Type of property: single family home
  • Living and lot size (sqft): 1,219 / 13,068
  • Year built: 1952
  • Beds, full baths and half baths: 3 / 2
  • Garage: 0
  • Water front or access: no / no
  • Exterior walls and roof: concrete / shingle
  • Floor and pool: terrazzo and wood/ no
  • Heating and cooling: central / central
  • Sewer: septic

What’s Up Around This Home?


Local Schools:

Monthly Mortgage Payment at 4.5% interest rate, 30-year fixed, and purchase price of $355,000:

  • FHA loan with 3.5% down: $1,735
  • Conventional loan with 5% down: $1,709
  • Conventional loan with 10% down: $1,619
  • Conventional loan with 20% down: $1,439

Need other mortgage scenarios? Mortgage Calculator

Location:


Area Demographics:

  • Average Income: $94,316
  • Population: 31,987
  • Owners vs Renters: 64% and 36%

Check out the latest South Miami 33143 Demographics Summary or South Miami 33143 Demographics Detailed analysis.

Nearest Rotary Clubs:

What’s Rotary? Neighbors, community leaders, and global citizens uniting for the common good. Learn more at Rotary.org

Questions? Call / Text 305.305.1535 or Email Me!

← Back

Thank you for your response. ✨

Condo-Townhouse Prices Up 27%.


Average Condo-Townhouse Price: Year-to-date May 2010 vs Year-to-date May 2014

Below graph details the comparison between the average condo-townhouse price in 2010 versus 2014 by city. For example.  Kendall’s average condo-townhouse price year-to-date May 2010 was $106,239.  Such average price has risen to $147,885 year-to-date May 2014.

average condo townhouse price

How’s the single-family home market? Learn more.

Days On Market or DOM – Condo-Townhouse: Year-to-date May 2014

The below chart shows the number of days a property stays in the market for sale until it is sold. For example. Kendall’s DOM year-to-date May 2014 is 123 days. In other words, on average…from the moment a condo-townhouse hits the market for sale until it is sold is approximately 123 days.

days on market condo townhouse


Transaction Type – Condo-Townhouse: Year-to-date May 2014

The below graph details the type of sales taking place by city. For example. In Kendall…29% of all sold condo-townhouses are bank owned.  Fifty-four percent are regular sales. And 17% of all sold condo-townhouses are short sales.

transaction type condo townhouse

Three Ways To Get More Bang For Your Home

more bang for your homeSo how can you squeeze every penny out of a buyer interested in your home without the use physical force or black mailing?

Yesterday, I met with a potential client that wanted to get $400,000 when similar homes in her neighborhood were going for $350,000.  Here is how the dialog went.

  • Client: what can we do to up the price?
  • Me: how long would you like to sell home in?
  • Client: as soon as possible, but renting this property may also be an option.
  • Me: is upgrading the property an option?
  • Client: depends on the upgrades and their cost

Given her responses, below were my three suggestions to her.

1. Ride The Market

Although I don’t recommend this option (you’ll most likely be wasting time and attracting window shoppers), if you are itching to get your home in the market…then do it. But do it with the expectation to sit still for an extended amount of time.  As time moves forward, the expectation is that other homes will progressively sell at higher prices.  So once homes in your area begin to reach the price point you are looking for, your door may begin to get knocked on.

2. Upgrade Your Home

This option is a toss up because it all depends on the cost of the upgrade versus how much more money you will get for that upgrade.  Eighty percent of the time (given location of property, market conditions, and desired upgrade), my advice to clients is not to do the upgrade for most likely you will break even or loose money. Again, depending on the latter variables, seldom will an upgrade benefit your bottom line.

Why? Cost of construction/remodeling has gone thru the roof compared to a decade ago.  Parts and labor are not what they used to be…cheap-eeerrr.  Due to this reality of life, it makes things difficult for say a $15,000 pool to bring up the value of your home by more than…$15,000 (get it?).  Example:

– $15,000 cost of pool +$15,000 home appreciation = $0.00 more dollars in your bank account.

3. Sit On The Sidelines

What sidelines? I mean don’t put your property for sale. And wait till prices pick up.

This is the same as option 1 without placing your home in the market.  And this option is the one I recommend the most if you:

  1. Are not in a rush to sell, and
  2. Want more money for your home

Until the next real estate bust, prices should continue to move up, or at worst…stay flat.